Mastering a Robust Bollinger Bands Strategy for Market Edge
PineForge Team
Automated Trading Platform
Market noise often obscures genuine opportunities. You struggle with indecision, watching price action unfold without a clear plan. Emotion dictates your entries and exits, leading to missed trades or premature closures. This cycle erodes confidence and capital. Yet, clarity exists. A well-defined Bollinger Bands strategy cuts through the chaos, providing a visual guide to market volatility and potential reversals or continuations. You gain a powerful framework to assess price action, identify high-probability setups, and act decisively. This post equips you with the knowledge to build, refine, and automate your own Bollinger Bands approach, transforming raw data into actionable insights and consistent performance. Stop reacting. Start executing with precision.
Understanding Bollinger Bands: Your Volatility Compass
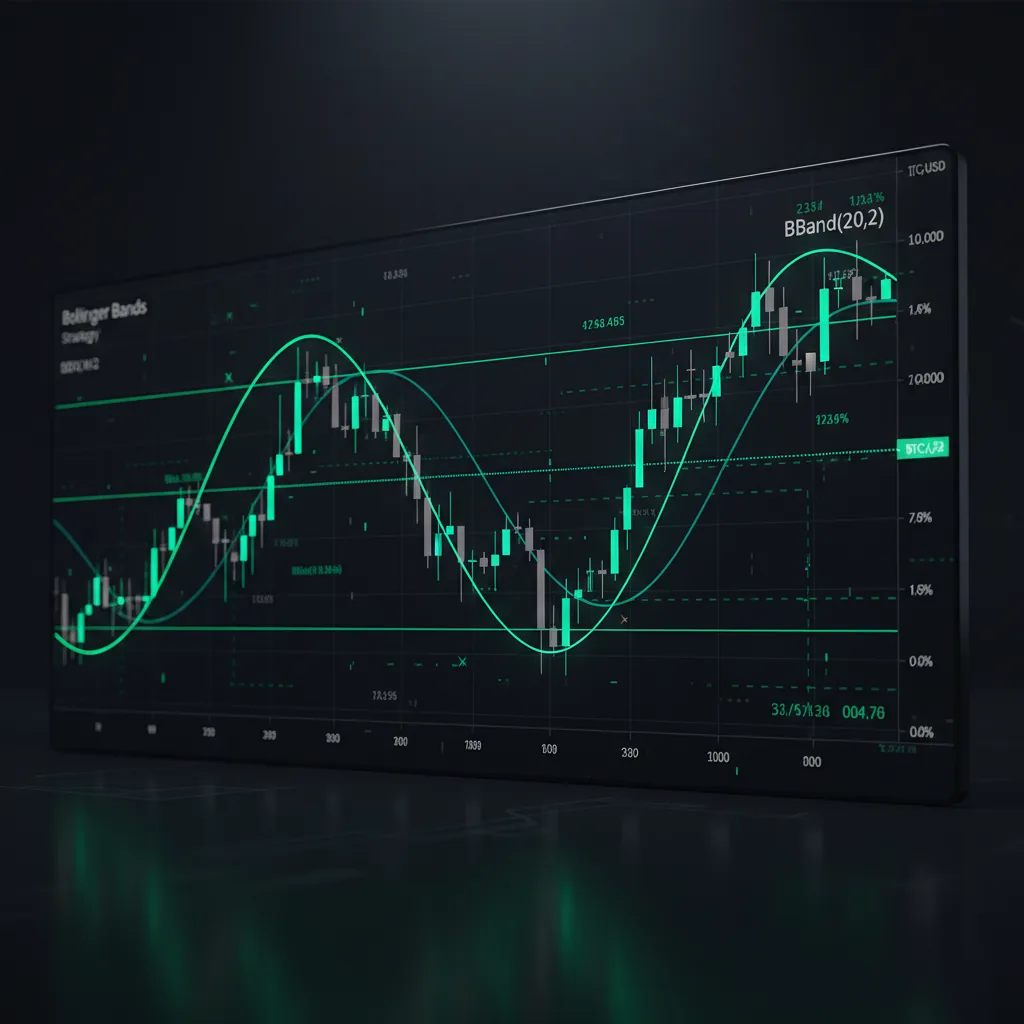
Bollinger Bands are not just lines on a chart. They are a dynamic envelope, adapting to market volatility. You see how price behaves relative to its average and its typical deviation. This tool empowers you to gauge whether the market is calm or volatile, signaling potential shifts in momentum.
The Core Components You Need to Know
Bollinger Bands consist of three key lines:
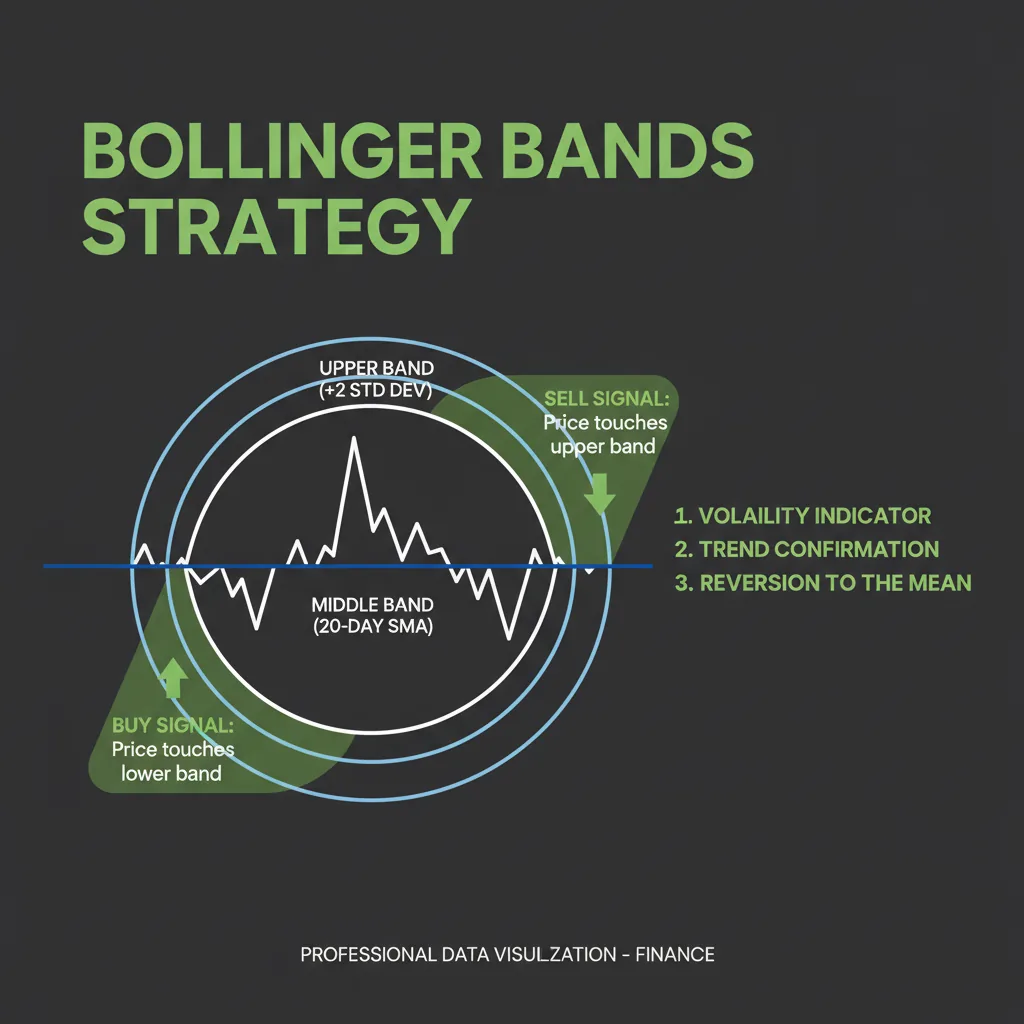
* Middle Band: This is a simple moving average, typically a 20-period SMA. It represents the asset's average price over a specific timeframe. You use it as a baseline for trend direction.
* Upper Band: Calculated by adding a set number of standard deviations (usually 2) to the Middle Band. Price often touches or breaks this band during strong upward movements.
* Lower Band: Calculated by subtracting the same number of standard deviations from the Middle Band. Price often touches or breaks this band during strong downward movements.
These bands expand when volatility increases and contract when volatility decreases. This visual representation is crucial for any effective Bollinger Bands strategy. You interpret the width of the bands as a direct measure of market energy. Narrow bands mean low energy; wide bands mean high energy.
The Relationship Between Price and Bands
Price tends to revert to the Middle Band. When price moves beyond an outer band, it often signals an overextended condition, suggesting a potential reversal. However, during strong trends, price can 'walk' along an outer band, indicating sustained momentum. You must discern these nuances to apply your strategy correctly.
Mastering the Bollinger Bands Strategy: Squeeze and Breakout
The Bollinger Squeeze is a cornerstone of volatility-based trading. You identify periods of low market activity, followed by explosive moves. This setup provides clarity on when to anticipate a significant price action.
Identifying the Bollinger Squeeze
A Bollinger Squeeze occurs when the bands narrow significantly, coming closer to the Middle Band. This signals a period of low volatility and consolidation. You recognize this as the market 'coiling' before a large move. It's a waiting game. You prepare for the breakout.
Capitalizing on Breakouts
Once a squeeze is identified, you look for a breakout. This happens when price decisively moves outside the contracting bands, accompanied by expanding bands. A close outside the bands confirms the breakout direction. You use this signal for trend initiation.
Here's how you might identify a squeeze in Pine Script:
\\\`pine
//@version=5
indicator("Bollinger Squeeze Detector", shorttitle="BBS", overlay=true)
length = input.int(20, "BB Length", minval=1)
mult = input.float(2.0, "BB StdDev", minval=0.001)
src = close
sma = ta.sma(src, length)
stddev = ta.stdev(src, length)
upper = sma + stddev * mult
lower = sma - stddev * mult
bandWidth = (upper - lower) / sma * 100
squeezeThreshold = input.float(0.05, "Squeeze Threshold (as % of SMA)", minval=0.01, maxval=0.5)
isSqueeze = bandWidth < squeezeThreshold
plotshape(isSqueeze, title="Squeeze Detected", location=location.belowbar, color=color.new(color.purple, 0), style=shape.triangleup, text="Squeeze", textcolor=color.white, size=size.small)
plot(sma, "SMA", color.blue)
plot(upper, "Upper BB", color.red)
plot(lower, "Lower BB", color.red)
\\\`
This script helps you visualize squeeze conditions. You can adapt it to trigger alerts or integrate it into a larger trading bots strategy on PineForge.
Squeeze vs. Breakout
You need to distinguish between the two states to act correctly:
Combining with Other Indicators
Enhance your Bollinger Bands strategy by pairing it with other trading indicators. For instance, an RSI oscillator can confirm overbought or oversold conditions during a reversal. MACD can signal momentum shifts. You combine these tools to build a more robust system, filtering out false signals.
Bollinger Bands Strategy: Reversals and Walk
Beyond squeeze and breakout, Bollinger Bands offer powerful insights into trend reversals and continuations. You learn to read price interaction with the bands for clearer signals.
Identifying Reversal Signals
When price touches or crosses an outer band and then pulls back inside, it often signals a potential reversal. For example, if price touches the upper band and then closes below it, you might anticipate a short-term downtrend. You look for confirmation from candlestick patterns or other indicators.
Understanding the Bollinger Walk
During strong trends, price can 'walk' along one of the outer bands. This means the trend is sustained and powerful. You avoid premature exits. For an uptrend, price will repeatedly touch or hug the upper band. For a downtrend, it will hug the lower band. You ride the trend until price breaks decisively back towards the Middle Band.
Here’s a simplified Pine Script snippet to detect a potential reversal from the upper band:
\\\`pine
//@version=5
indicator("BB Reversal Signal", shorttitle="BBRS", overlay=true)
length = input.int(20, "BB Length", minval=1)
mult = input.float(2.0, "BB StdDev", minval=0.001)
src = close
sma = ta.sma(src, length)
stddev = ta.stdev(src, length)
upper = sma + stddev * mult
lower = sma - stddev * mult
upperBandTouch = src[1] < upper[1] and src >= upper
closeBelowUpper = close < upper
reversalSignal = upperBandTouch and closeBelowUpper
plotshape(reversalSignal, title="Upper Reversal", location=location.abovebar, color=color.new(color.orange, 0), style=shape.triangledown, text="Reversal", textcolor=color.white, size=size.small)
\\\`
This script provides a visual cue for upper band reversals. You can expand on this logic for entry and exit conditions within your automated algorithmic trading system.
Entry and Exit Rules for Bollinger Bands
Your entries often align with breakouts or confirmed reversals. Exits can be based on price returning to the Middle Band, touching the opposite band, or a trailing stop-loss. Always integrate robust risk management practices. You define your stop-loss and take-profit levels before entering any trade.
Implementing Your Bollinger Bands Strategy with Automation
Manual trading introduces emotion and delay. You miss opportunities. You second-guess your analysis. Automation removes these human frailties, allowing your Bollinger Bands strategy to execute with precision and discipline.
The Human Element vs. Machine Precision
Your greatest enemy in trading is often yourself. Fear and greed cloud judgment. A machine, however, follows rules without hesitation. It executes trades based on your predefined Bollinger Bands strategy, every time. This consistency is your edge.
Automate Your Strategy with PineForge
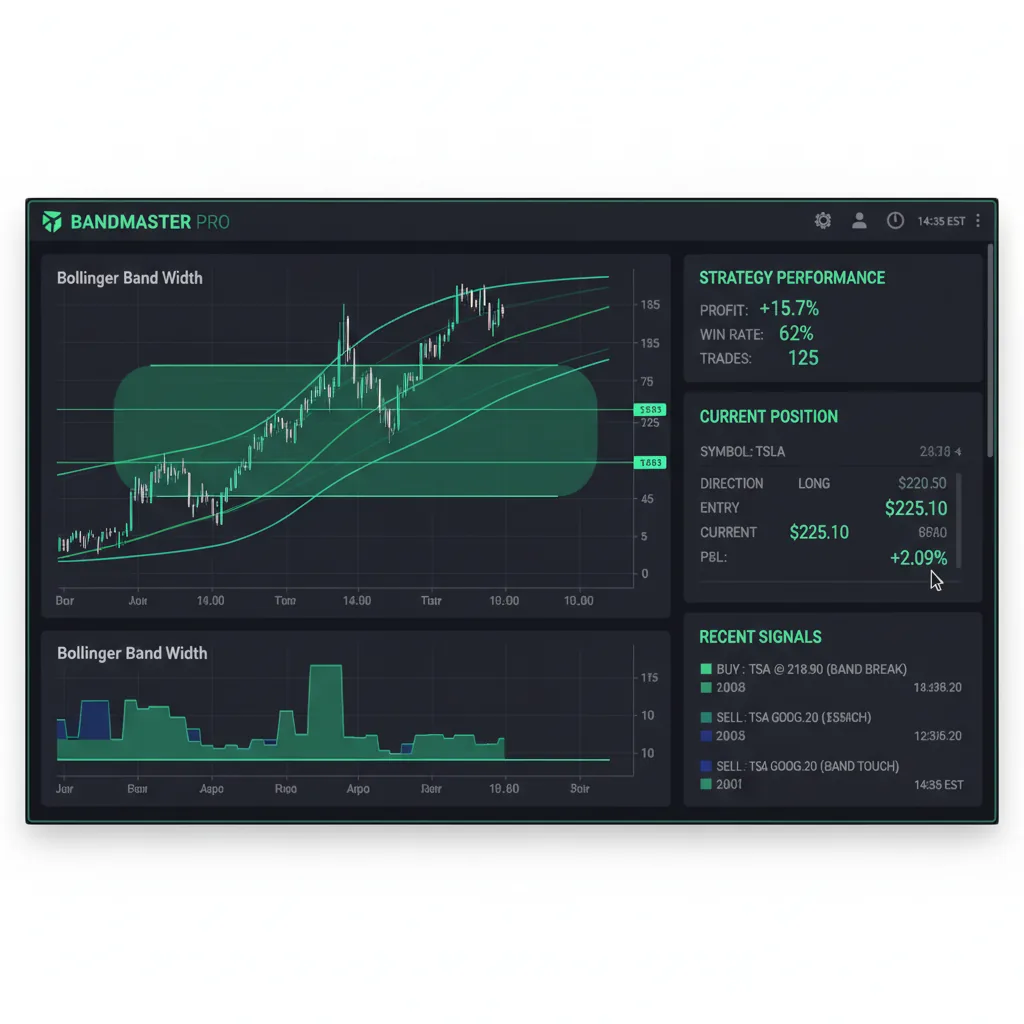
PineForge empowers you to transform your Bollinger Bands strategy into an automated trading bot. You write your rules in Pine Script, backtest them against historical data, and deploy them live. This platform handles the execution, so you focus on strategy development, not manual order entry.
Backtesting is paramount. Before deploying any strategy live, you must backtest it thoroughly. This process validates your Bollinger Bands strategy against past market conditions, revealing its true performance characteristics. For example, a BTCUSD swing strategy on PineForge delivered a +124.6% return with a 62.8% win rate and a Sharpe of 2.14. You aim for similar statistical rigor.
Optimizing for Different Markets
Bollinger Bands are versatile. You can apply them to forex vs crypto, stocks, or commodities. However, each market has unique volatility characteristics. Your Bollinger Bands strategy will require optimization for specific assets and timeframes. A strategy that works for gold strategies on a daily chart might not perform as well on a 15-minute crypto chart. You adjust the \length\ and \mult\ parameters accordingly.
FAQ: Your Bollinger Bands Strategy Questions Answered
How do you read Bollinger Bands for trading?
You read Bollinger Bands by observing the price's relationship to the three lines. Price near the middle band suggests equilibrium. Price touching or breaking the outer bands indicates strong momentum or potential overextension. Narrow bands signal low volatility (squeeze), while wide bands suggest high volatility (breakout). You interpret these visual cues to make informed decisions.
What is the best Bollinger Bands strategy?
There isn't one single "best" Bollinger Bands strategy. Effective strategies often involve combining the Bollinger Squeeze for trend identification and breakouts, or utilizing reversals from the outer bands. You gain an advantage by integrating Bollinger Bands with other indicators like RSI or MACD for confirmation. The best strategy is the one you've rigorously backtested and understand, tailored to your risk tolerance and market.
Can Bollinger Bands predict price?
Bollinger Bands do not directly predict future price. Instead, they provide a visual representation of price volatility and its historical range. They help you identify conditions where price is likely to move (e.g., after a squeeze) or where a trend might be overextended. You use them as a probability tool, not a crystal ball.
What timeframe is best for Bollinger Bands?
Bollinger Bands are adaptable to almost any timeframe. You can use them on short timeframes for day trading or longer timeframes for swing trading or position trading. The key is to adjust the \length\ and \mult\ parameters to fit the chosen timeframe and asset. A 20-period setting is common, but you may find different settings more effective for specific markets. Consistency in your chosen timeframe is crucial for accurate analysis.
Take Control with Your Bollinger Bands Strategy
You now possess a deeper understanding of the Bollinger Bands strategy. You see how to identify squeezes, capitalize on breakouts, spot reversals, and ride trends. The difference between erratic trading and consistent performance lies in disciplined execution. Manual trading hinders this discipline; automation empowers it.
PineForge offers the tools you need. You develop your strategy in Pine Script, backtest it thoroughly, and deploy it to execute without emotion. Stop leaving your trading success to chance. Define your rules, validate them with data, and let the machine do the heavy lifting. Your trading journey evolves from reactive to strategic. Take the next step. Signup for PineForge today and build your first bot to put your Bollinger Bands strategy into action. Master your markets. Control your outcomes.
| Feature | Bollinger Squeeze | Bollinger Breakout |
|---|---|---|
| Volatility | Low, bands contract | High, bands expand |
| Price Action | Consolidating, sideways | Strong directional move, often with volume |
| Signal | Anticipation of future move | Confirmation of current move's direction |
| Trading Action | Wait for direction, prepare entry | Enter in direction of breakout |
Start Trading Smarter
Build, backtest, and deploy your strategies with PineForge. No coding experience required.