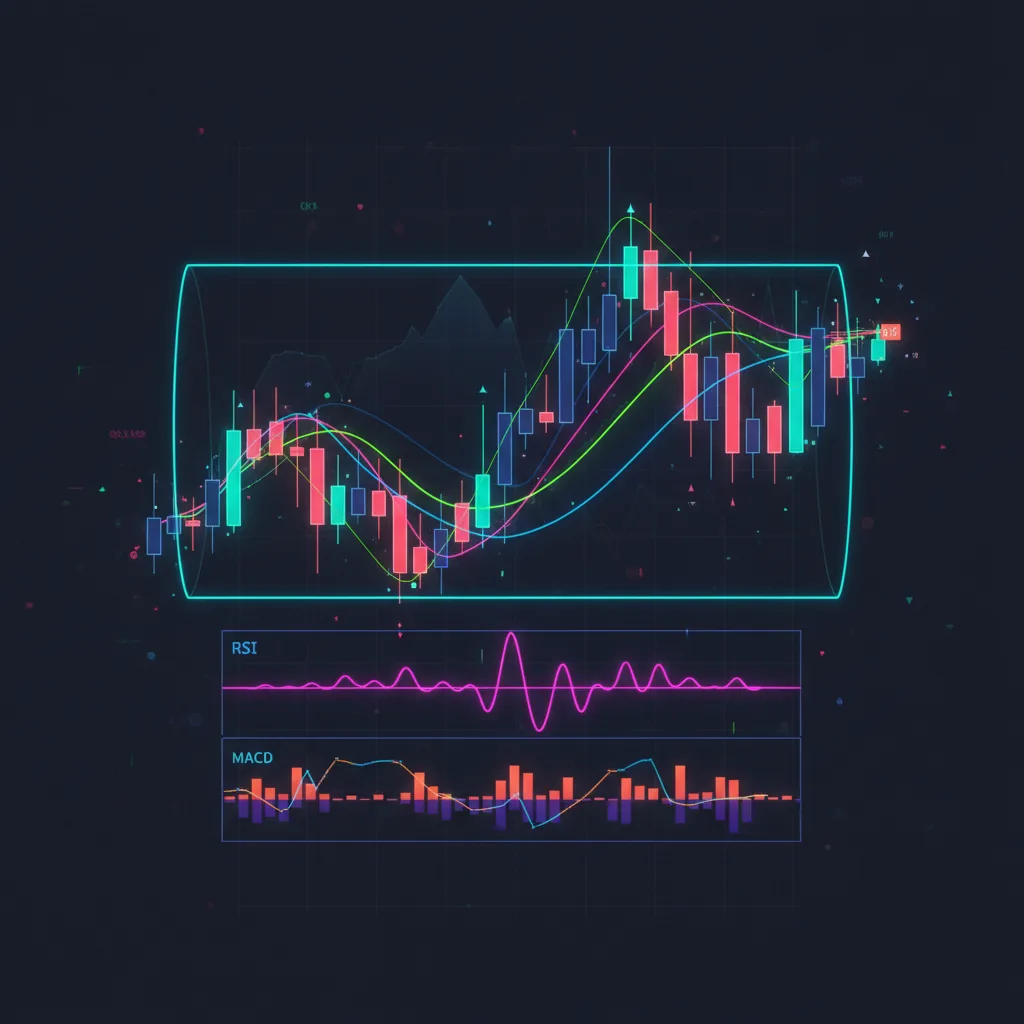
Trading Indicators Explained: RSI, MACD, EMA, Bollinger Bands & ATR
PineForge Team
Automated Trading Platform
Trading indicators are mathematical calculations applied to price data. They help you identify trends, momentum, volatility, and potential reversal points.
But here's the catch: indicators don't predict the future. They describe the present. The edge comes from combining the right indicators with proper risk management and letting a trading bot execute without hesitation.
Here's every indicator you need to know — with Pine Script code you can use on PineForge today.
Trend Indicators
Moving Averages: SMA vs EMA
The foundation of technical analysis.
SMA (Simple Moving Average): Equal weight to all periods. Slower, smoother, less reactive to sudden moves.
EMA (Exponential Moving Average): More weight on recent prices. Faster, more responsive. Preferred for algo trading.
How to use them:
fast = ta.ema(close, 9)
slow = ta.ema(close, 21)
bullish = ta.crossover(fast, slow)
bearish = ta.crossunder(fast, slow)
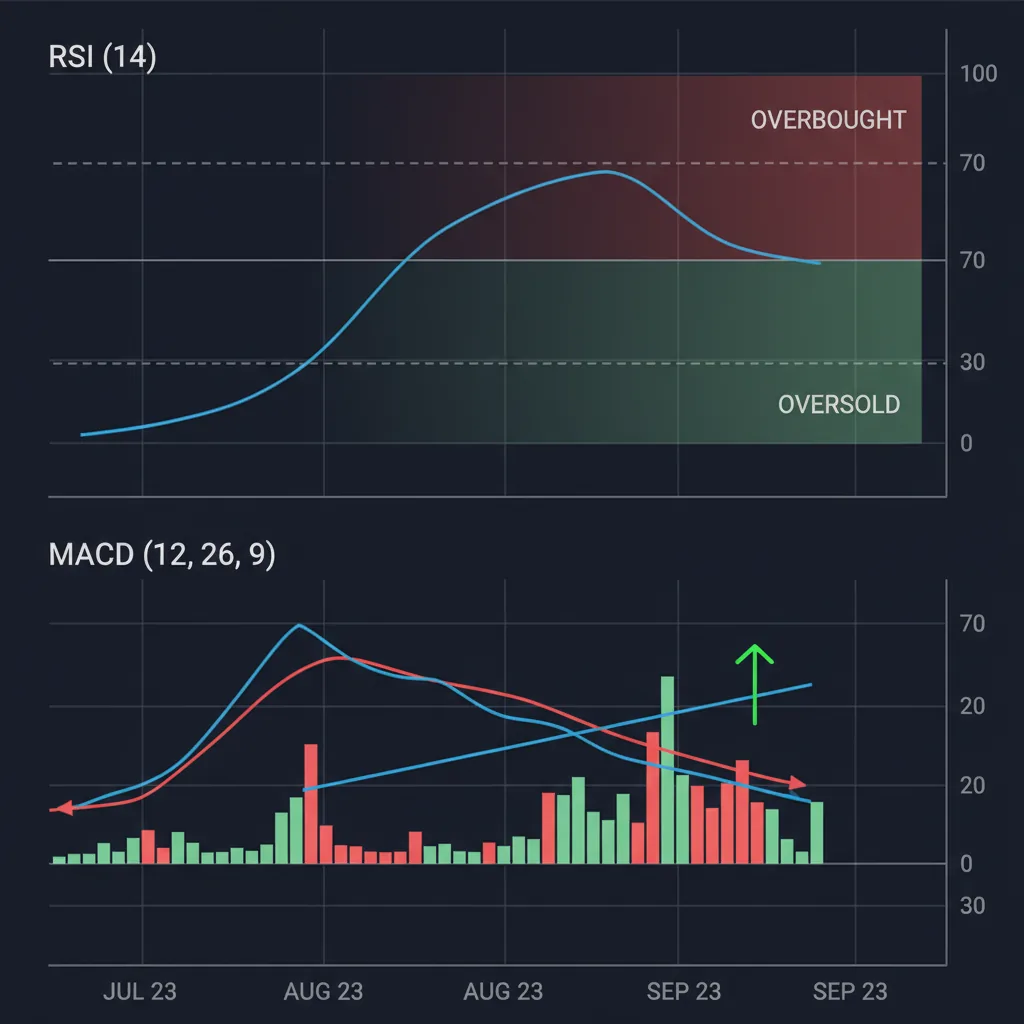
MACD: Momentum Meets Trend
The MACD reveals momentum shifts by measuring the relationship between two EMAs.
Components:
Trading signal: Buy when MACD crosses above signal. Sell when it crosses below.
[macdLine, signalLine, hist] = ta.macd(close, 12, 26, 9)
buy_signal = ta.crossover(macdLine, signalLine)
sell_signal = ta.crossunder(macdLine, signalLine)
Momentum Indicators
RSI: Overbought and Oversold
The Relative Strength Index measures the speed and magnitude of price changes on a scale of 0 to 100.
Key levels:
rsi = ta.rsi(close, 14)
oversold = rsi < 30
overbought = rsi > 70
RSI works best as a filter, not a standalone signal. Combine it with a trend indicator for higher-probability trades. Example: only buy RSI oversold bounces when price is above the 50 EMA.
Volatility Indicators
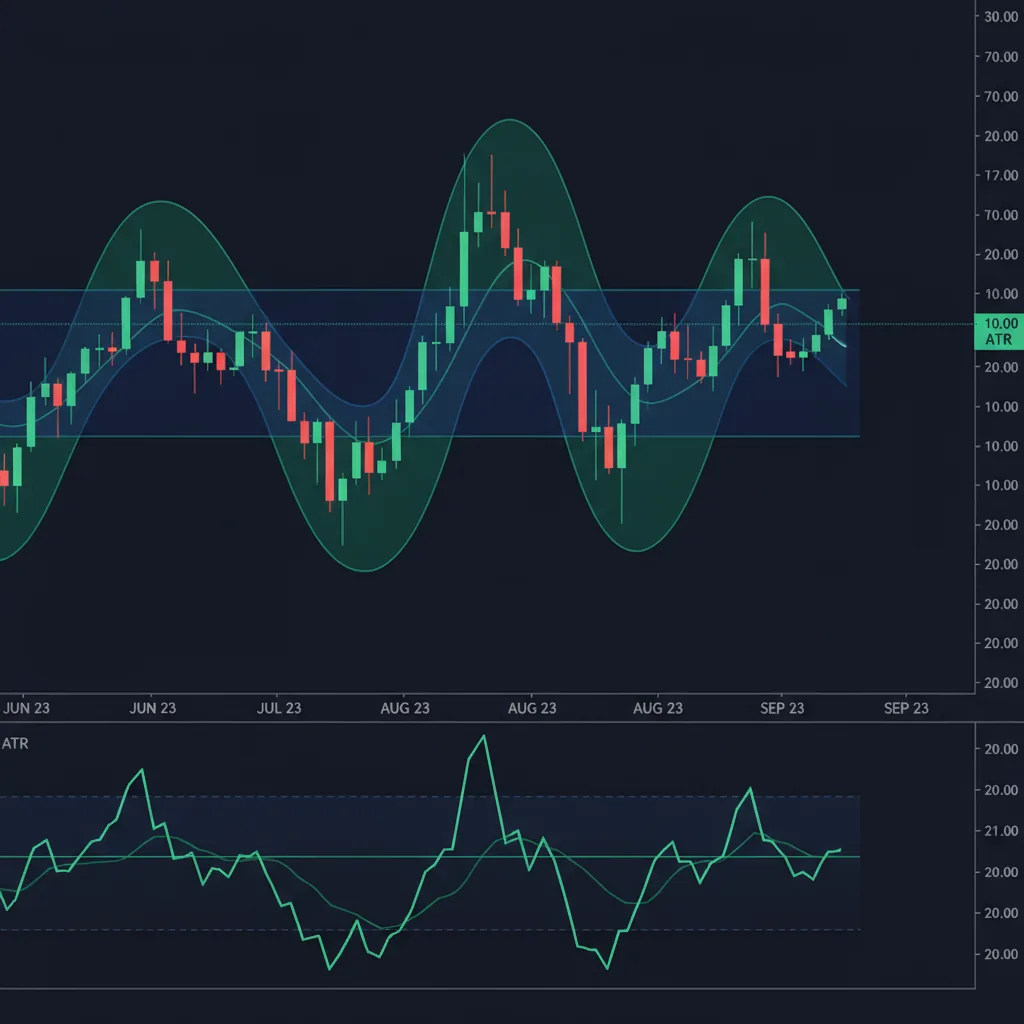
Bollinger Bands
Bollinger Bands measure volatility using standard deviations from a moving average.
Components:
Trading signals:
[mid, upper, lower] = ta.bb(close, 20, 2)
at_lower = close <= lower
at_upper = close >= upper
squeeze = (upper - lower) / mid < 0.02  // narrow bands
ATR: The Volatility Ruler
The Average True Range measures how much price moves per bar. It doesn't indicate direction — just magnitude.
Why ATR matters for algo trading: It's the best way to set dynamic stop-losses that adapt to market conditions.
atr = ta.atr(14)
dynamic_stop = close - 2 * atr  // widens in volatile markets
In a calm market, ATR is small → tight stop. In a volatile market, ATR is large → wider stop. This prevents getting stopped out by normal noise while still protecting against real reversals.
How Should You Combine Trading Indicators?
The best strategies combine indicators from different categories:
Avoid: combining indicators from the same category (e.g., RSI + Stochastic). They measure similar things and don't add real information.
From Indicators to Automated Strategy
Every indicator on this page is available in Pine Script and fully supported by PineForge's backtesting and live trading engine.
The workflow:
Test indicator strategies on PineForge — backtest any combination in seconds.
fast = ta.ema(close, 9)
slow = ta.ema(close, 21)
bullish = ta.crossover(fast, slow)
bearish = ta.crossunder(fast, slow)[macdLine, signalLine, hist] = ta.macd(close, 12, 26, 9)
buy_signal = ta.crossover(macdLine, signalLine)
sell_signal = ta.crossunder(macdLine, signalLine)rsi = ta.rsi(close, 14)
oversold = rsi < 30
overbought = rsi > 70[mid, upper, lower] = ta.bb(close, 20, 2)
at_lower = close <= lower
at_upper = close >= upper
squeeze = (upper - lower) / mid < 0.02 // narrow bandsatr = ta.atr(14)
dynamic_stop = close - 2 * atr // widens in volatile markets| Combination | Purpose | Example |
|---|---|---|
| Trend + Momentum | Direction + Timing | EMA for trend, RSI for entry |
| Trend + Volatility | Direction + Stops | EMA for trend, ATR for stop-loss |
| Momentum + Volatility | Signals + Risk | RSI for signals, Bollinger for confirmation |
Start Trading Smarter
Build, backtest, and deploy your strategies with PineForge. No coding experience required.