Walk-Forward Analysis: How to Stop Overfitting Your Trading Bot
PineForge Team
Automated Trading Platform
Every trader who's ever optimised a strategy knows the feeling. You tweak parameters, run a new backtest, and the equity curve looks better. You tweak again. Better still. By the tenth iteration, your strategy posts a 98% win rate, a 5.2 profit factor, and a smooth-as-glass equity climb across five years of historical data. You deploy it live. Two weeks later, the account is bleeding.
This is overfitting. It's the most expensive mistake in retail algorithmic trading, and walk-forward analysis is the technique that prevents it. This guide explains what walk-forward is, why it works, and how to apply it on any strategy you're about to deploy — including a step-by-step walkthrough using PineForge's backtest engine.
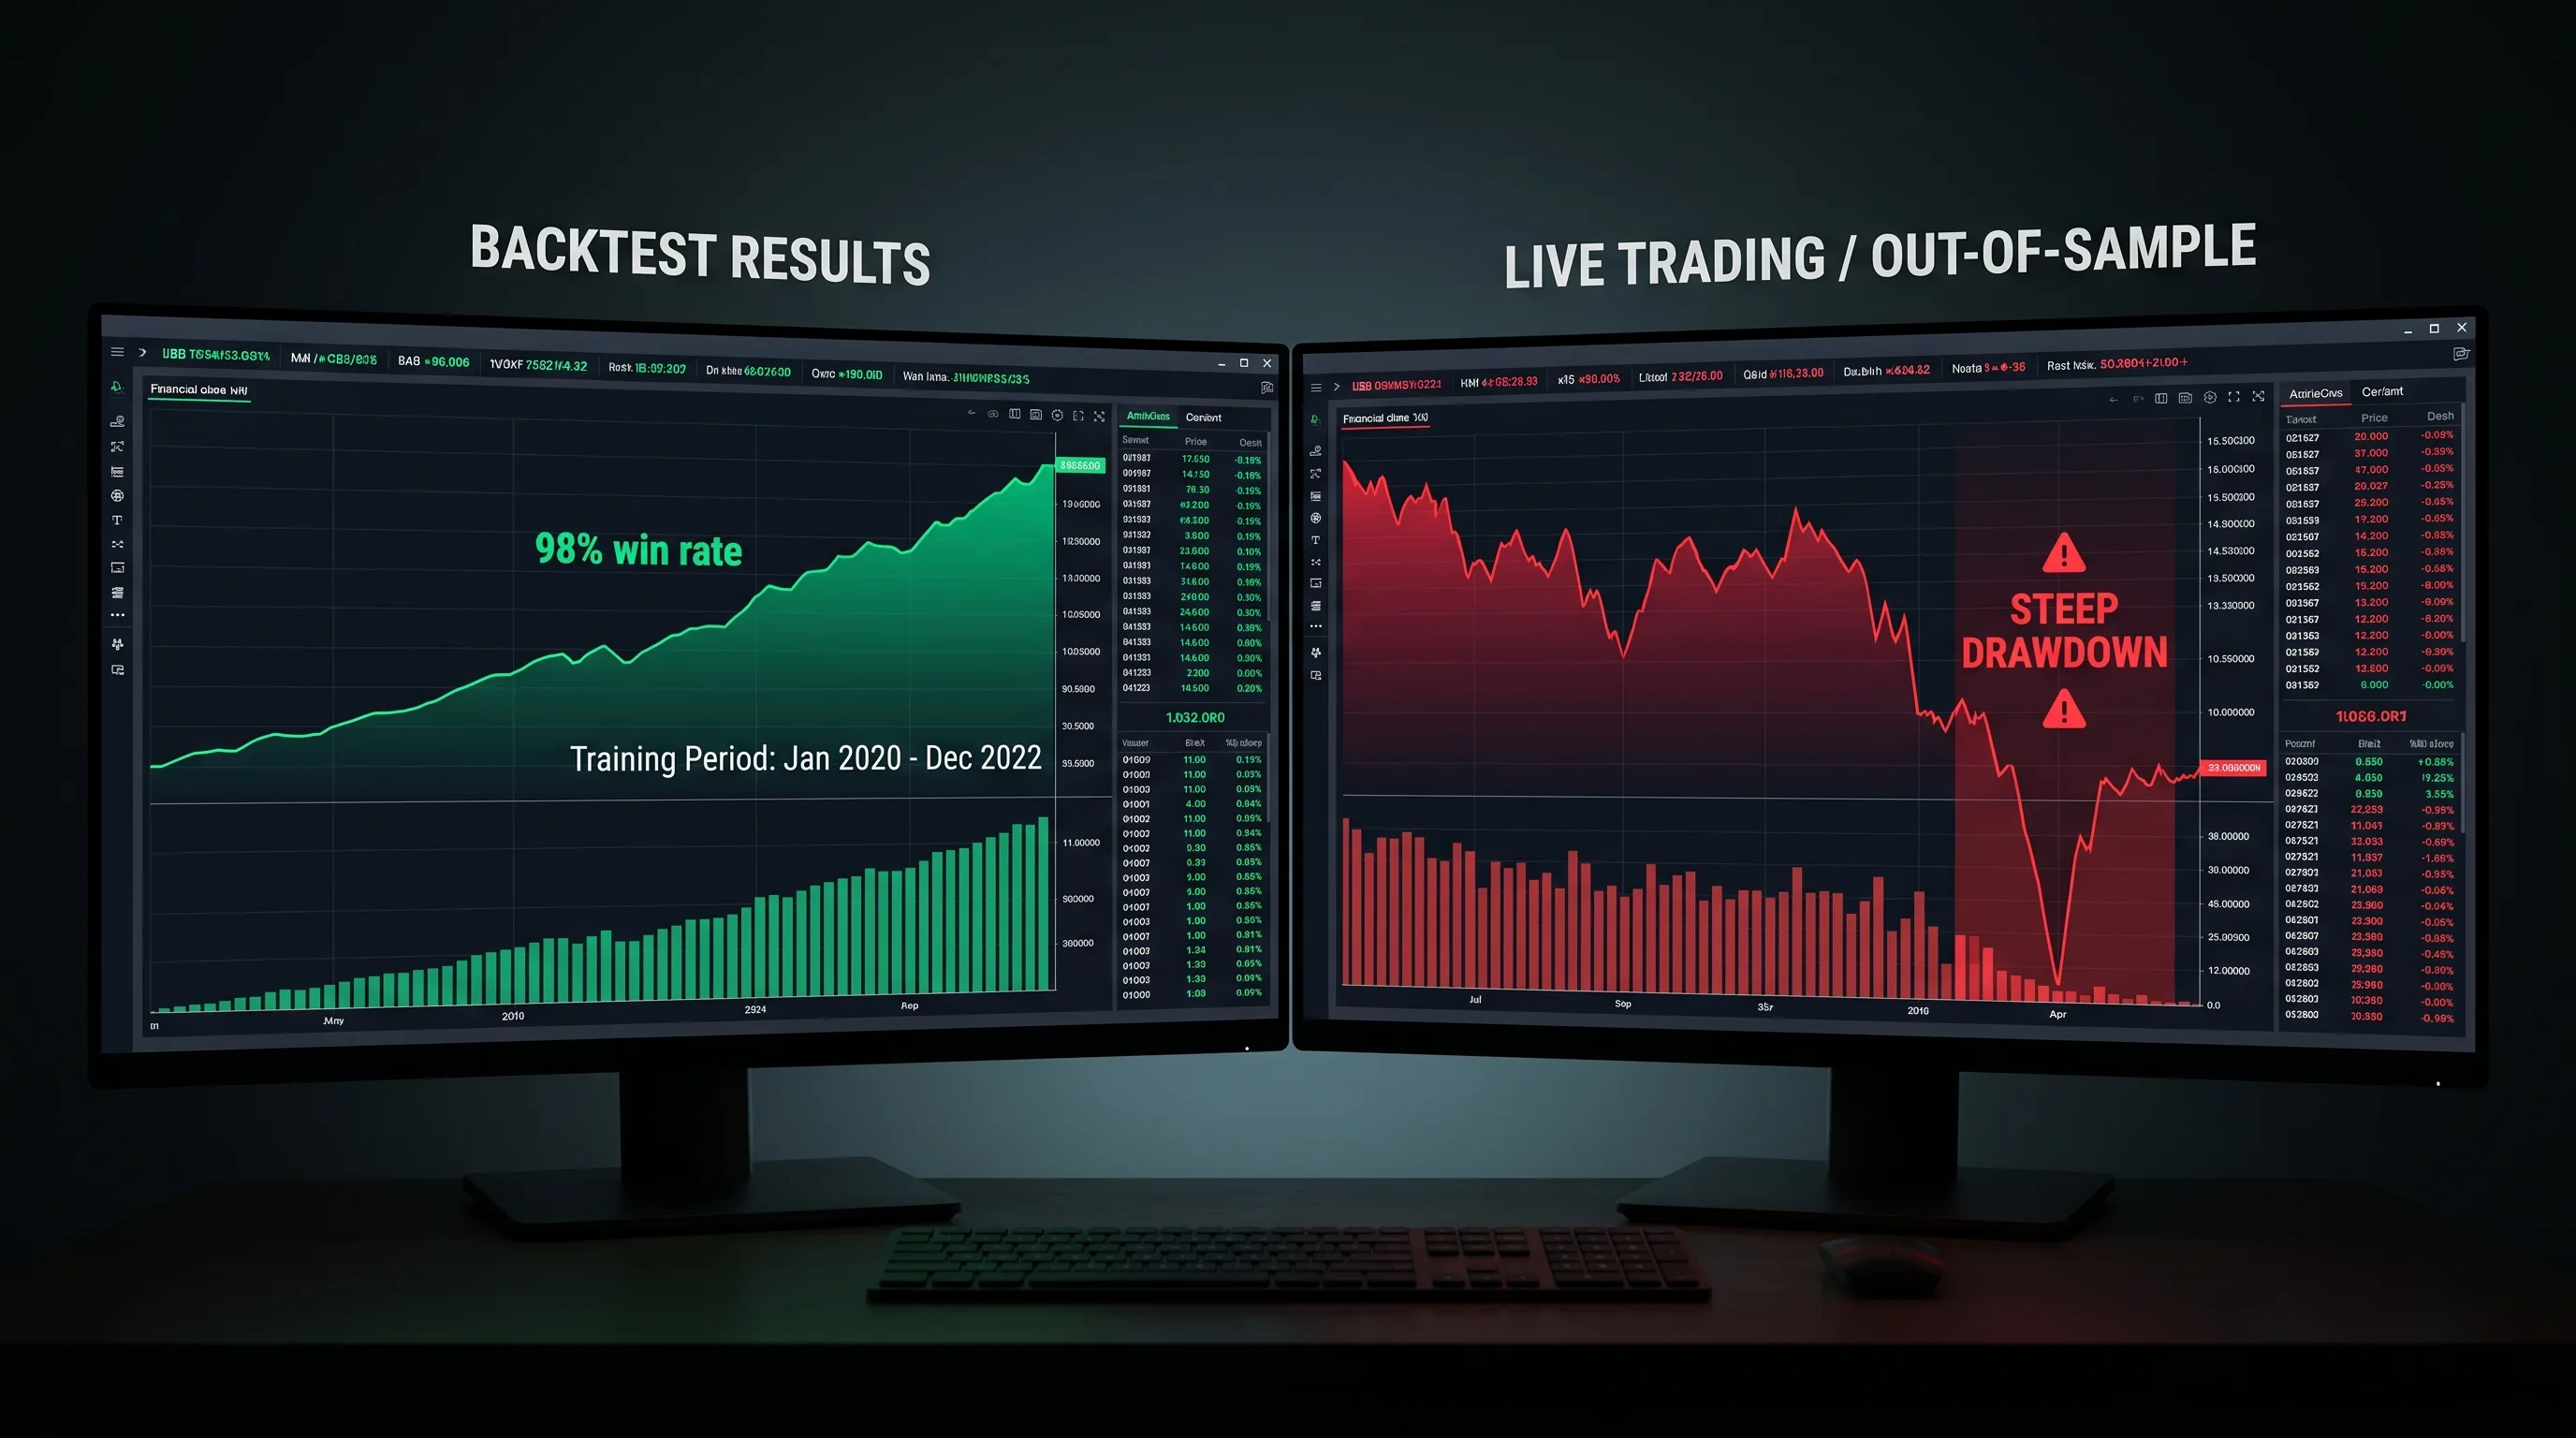
If the image above looks familiar, this article is for you.
What Is Walk-Forward Analysis?
Walk-forward analysis is a backtesting protocol that simulates how a strategy would have performed if you'd deployed it sequentially through history — never letting the strategy "see" data it hasn't already traded through.
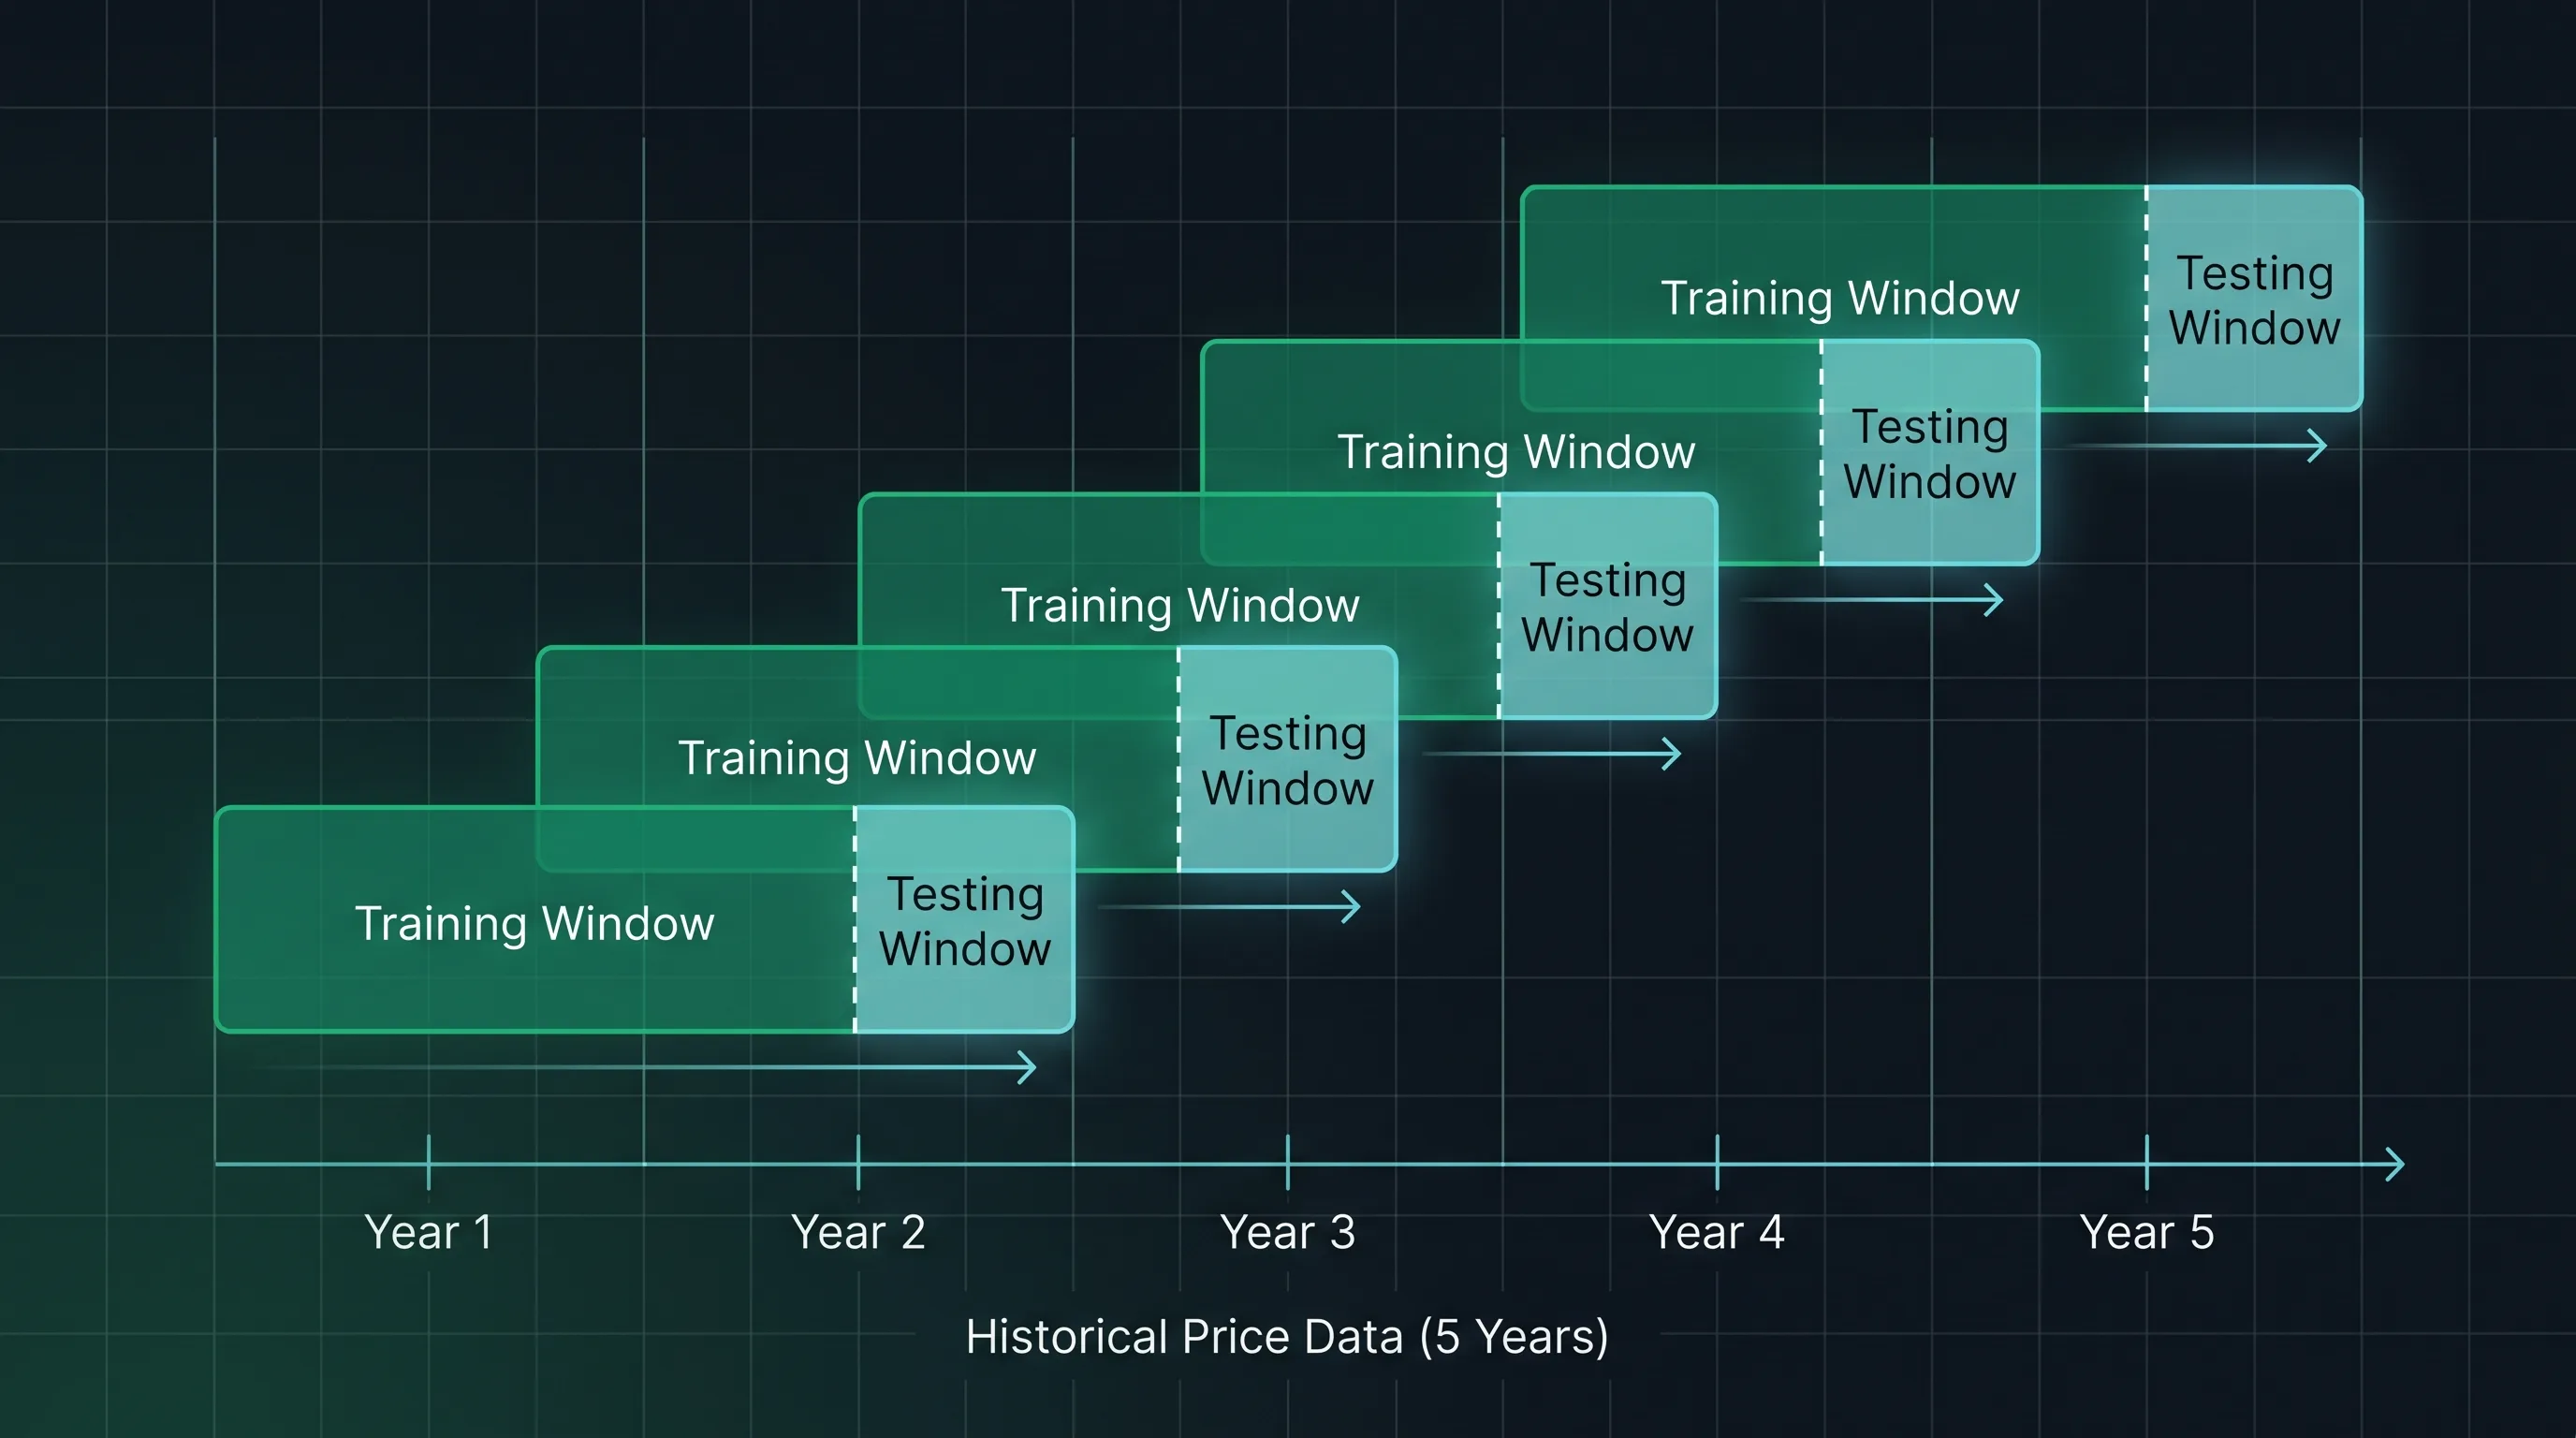
Instead of training your strategy on five years of XAUUSD data and patting yourself on the back when it makes money on the same five years, walk-forward splits your historical data into rolling training and testing windows:
The result is a true out-of-sample track record: how your strategy would have performed if you'd deployed it in 2022 with parameters chosen from 2021 data, then redeployed in 2023 with parameters chosen from 2022 data, and so on. That's how live trading actually works. That's what your backtest should simulate.
Investopedia's walk-forward optimisation primer covers the academic origin of the method — it dates to the late 1990s — but the technique remains underused by retail traders because most platforms don't expose it cleanly.
Why Standard Backtests Lie to You
A standard backtest commits two sins. First, it lets you optimise on all your data, then evaluates on the same data. Second, it doesn't account for the fact that markets change — what worked in trending 2024 gold doesn't necessarily work in ranging 2018 gold.
The Overfitting Trap
Every additional parameter you add to a strategy multiplies the search space. Three indicators, each with a "length" parameter that can take 20 values, gives you 8,000 combinations. Run a brute-force optimisation across all of them and statistics guarantees you'll find a combination that looks brilliant on your specific dataset — even if the strategy has zero real edge.
This is the curve-fitting problem, and Quantified Strategies' overview of overfitting risks walks through how easy it is to manufacture a 90%+ win rate strategy that fails the moment you take it live.
Why Win Rate Alone Won't Save You
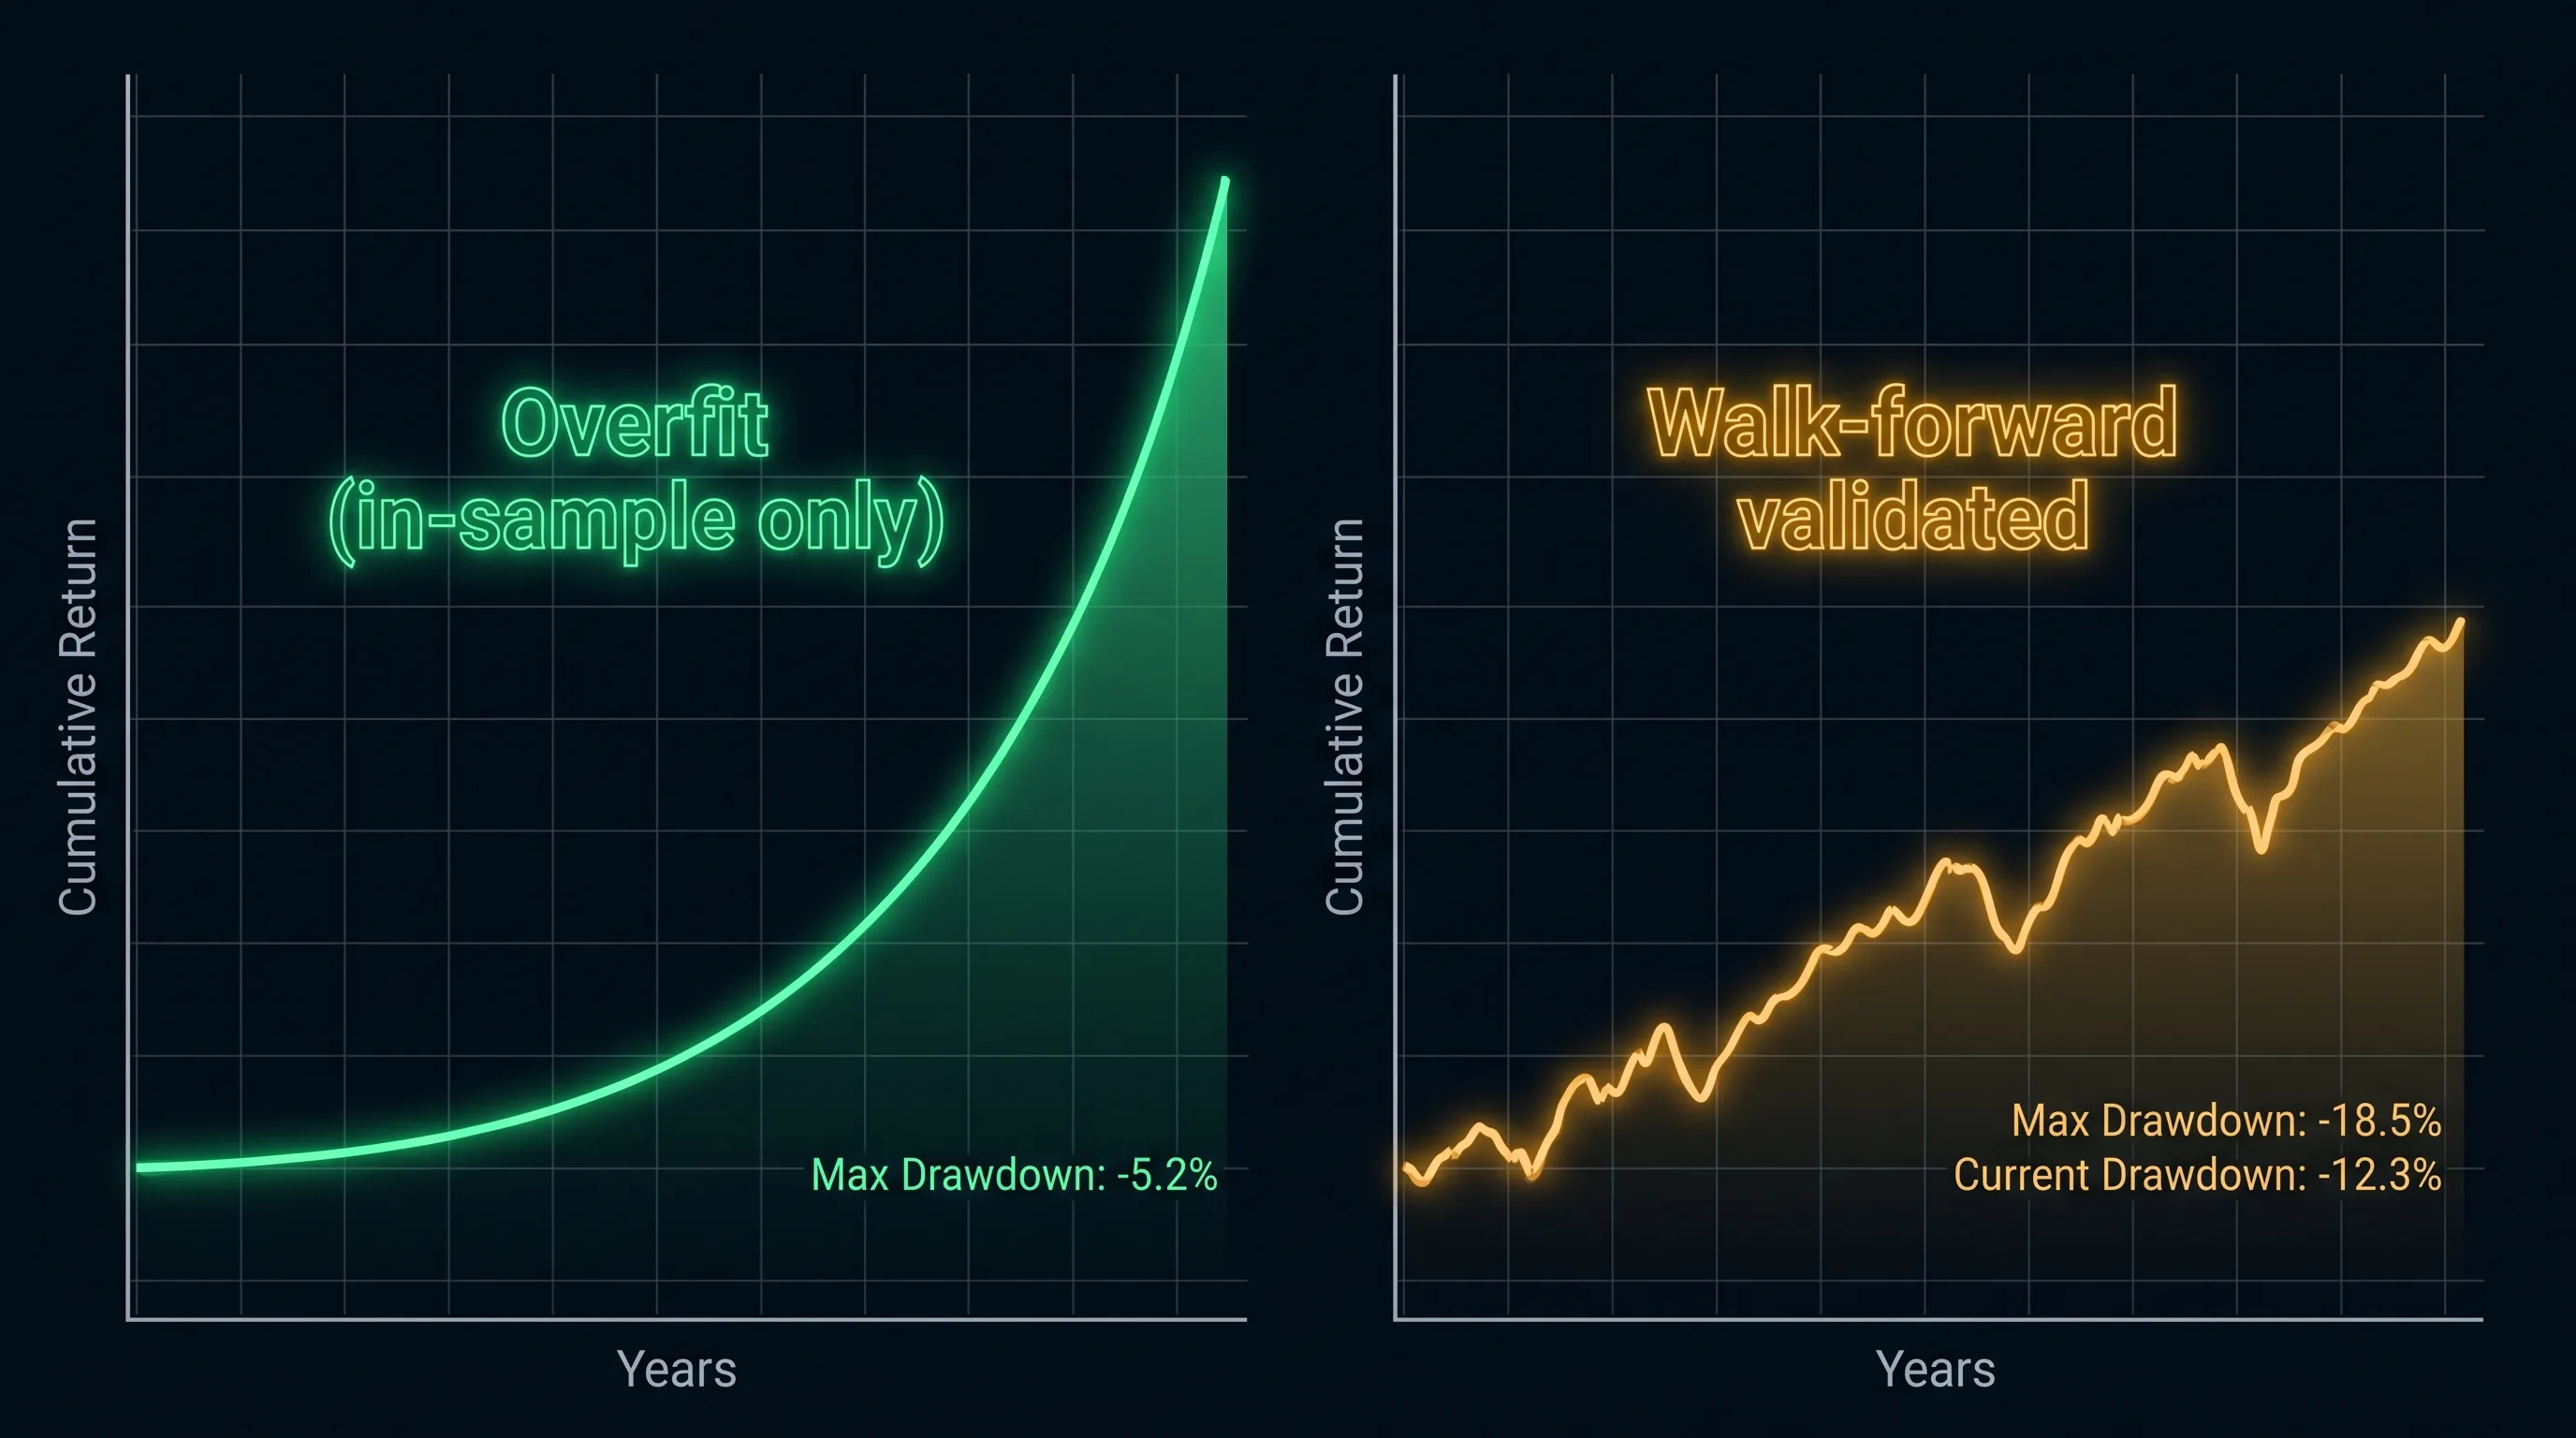
A high win rate paired with a high profit factor *can* still be overfit. Even those metrics describe behaviour on data you've already chosen parameters for. The only way to escape the trap is to evaluate performance on data the strategy has never optimised against — and that's exactly what walk-forward forces you to do.
For more on metric interpretation, see profit factor vs win rate. Once you've internalised those metrics, walk-forward is the validation layer that makes them trustworthy.
How Walk-Forward Analysis Works in Practice
The mechanics are simple, but the discipline is everything. Skip a step and you're back to a standard backtest with extra steps.
Step 1 — Split Your Data
For a 1H gold strategy with three years of data, a reasonable split looks like:
Over three years of data, that gives you 8-9 walk-forward iterations. More iterations means more statistical confidence — but you need enough trades per testing window for the results to be meaningful (~30 minimum, per the rule of thumb in our gold backtest guide).
Step 2 — Optimise on the Training Window Only
Use whatever parameter optimisation you want — grid search, genetic algorithm, manual tweaking — but the optimisation must touch *only* the training window. The testing window is sealed off. You don't even look at it.
This is the rule everyone breaks. They peek at the test data once, see results were bad, "adjust" their optimisation, and quietly contaminate the experiment. The discipline matters more than the math.
Step 3 — Apply the Best Parameters to the Testing Window
Without changing anything, run the optimised parameters on the testing window. Whatever the result is — good, bad, terrible — is what gets recorded. This is one walk-forward iteration's contribution to your true out-of-sample track record.
Step 4 — Slide the Window and Repeat
Move the training window forward by your step size (3 months in our example) and repeat. Each new iteration re-optimises parameters on fresh training data and evaluates on the next 3-month testing window. The strategy's parameters change over time — exactly as they would in a real adaptive live deployment.
Step 5 — Aggregate the Out-of-Sample Results
After all iterations, you have a stitched-together out-of-sample equity curve. This is the curve you trust. Total return, max drawdown, profit factor, Sharpe — all calculated only on out-of-sample testing windows, never on the optimisation periods.
If this curve still looks good, you have a strategy with real edge. If it collapses, you've just saved yourself from a live trading disaster.
Walk-Forward on PineForge: A Practical Workflow
PineForge doesn't yet automate the walk-forward loop — but the backtest engine is fast enough that you can run the iterations manually in 15-20 minutes. Here's how.
Setting Up Your First Walk-Forward Iteration
That's iteration one. Repeat with the windows shifted forward by three months until you've covered all your data.
Building the Aggregate Out-of-Sample Curve
For each iteration, you've recorded the testing-window stats. Stitch them together in a spreadsheet:
The aggregate — sum of test returns, weighted-average profit factor across testing windows — is your walk-forward result. Don't average the in-sample training results. Those are irrelevant.
Reading the Result Honestly
Three patterns to look for in your walk-forward table:
Common Mistakes That Defeat the Whole Point
Walk-forward only works if you respect the discipline. Five mistakes invalidate the entire exercise.
Peeking at Test Data
You ran iteration three. The testing window lost money. You go back and "tweak" the indicator. Now you're not doing walk-forward — you're doing standard optimisation across a longer time series. Stop.
Window Sizes Too Small for Statistical Significance
A 1-month testing window on a strategy that takes 4 trades per month gives you 4 data points. That's not a test, it's anecdote. Aim for at least 30 trades per testing window. If your strategy is too rare to hit that number, extend your training and testing windows proportionally.
Optimising Across Too Many Parameters
Walk-forward catches modest overfitting, not extreme overfitting. A strategy with 12 free parameters can curve-fit to almost any training window, then ride that overfit briefly into the testing window before crashing. As a rule of thumb, keep tuneable parameters under 5. Less is more.
Ignoring Transaction Costs in Walk-Forward
Spread, slippage, and commission costs need to be applied to the testing-window backtest with the same realism you'd expect in live trading. PineForge's backtest engine handles broker-style fills by default — make sure you're not running in an idealised "fill at signal price" mode.
Quitting at the First Bad Iteration
If iteration two loses money, don't abort. Run all the iterations. A single bad testing window is normal — markets have regimes, and not every regime suits every strategy. What matters is the aggregate across all iterations.
How Many Iterations Do I Need?
For a 1H strategy with 3 years of data, 6-10 iterations is the sweet spot. Less than 5 and your aggregate is too noisy to trust. More than 12 and your iterations become so short they each contain too few trades.
If you have less data than that, walk-forward isn't the right tool — use out-of-sample validation instead, which splits data into a single training set and a single held-out test set. It's less rigorous but workable for shorter datasets.
Can I Skip Walk-Forward If My Backtest Looks Solid?
You can. You probably shouldn't. Even backtests that look modest — 1.6 profit factor, 12% drawdown — can hide overfitting that walk-forward exposes. The cost is 15-20 minutes of clicking. The benefit is knowing whether your edge is real before you risk real capital.
The single most reliable predictor of live trading performance among retail traders isn't intelligence, capital, or strategy complexity. It's discipline around validation. Walk-forward is that discipline made systematic.
Conclusion
Three takeaways. First, standard backtests overstate strategy performance because they let you optimise on the same data you evaluate. Second, walk-forward analysis fixes this by forcing you to evaluate on data your strategy has never optimised against. Third, the discipline matters more than the math — peeking at test data, optimising too many parameters, or using too-small windows defeats the whole point.
You don't need expensive software to do this. You need a backtest engine that runs fast, a spreadsheet to track results across iterations, and the willpower to not cheat.
Backtest your strategy on PineForge — pay-as-you-go, no monthly fees, and run as many walk-forward iterations as you need before risking a single dollar live.
| Iteration | Train Window | Test Window | Test Return | Test PF | Test DD |
|---|---|---|---|---|---|
| 1 | 2024-01 → 2024-09 | 2024-10 → 2024-12 | +4.2% | 1.78 | -6.8% |
| 2 | 2024-04 → 2024-12 | 2025-01 → 2025-03 | -1.1% | 0.91 | -8.2% |
| 3 | 2024-07 → 2025-03 | 2025-04 → 2025-06 | +6.8% | 2.34 | -4.1% |
| 4 | 2024-10 → 2025-06 | 2025-07 → 2025-09 | +2.9% | 1.52 | -5.4% |
Start Trading Smarter
Build, backtest, and deploy your strategies with PineForge. No coding experience required.