
Mastering the Risk Reward Ratio: Strategies That Actually Work
PineForge Team
Automated Trading Platform
You chase big wins. You feel the pull of a high-return trade. But without a defined risk reward ratio, you're navigating the markets blindfolded. Emotional decisions dictate your outcomes, leading to inconsistent results and frustrating drawdowns. Sustainable trading demands a logical framework, a clear understanding of what you stand to lose versus what you stand to gain on every single trade. It's not about avoiding risk entirely; it's about controlling it, quantifying it, and leveraging it strategically. This guide cuts through the noise. You learn to define, calculate, and, most importantly, *optimize* your risk reward ratio, transforming your approach from reactive to calculated. Elevate your trading with a systematic edge. You build resilience, manage capital effectively, and position yourself for long-term success, not just fleeting victories.
The Core of the Risk Reward Ratio: Your Trading Blueprint
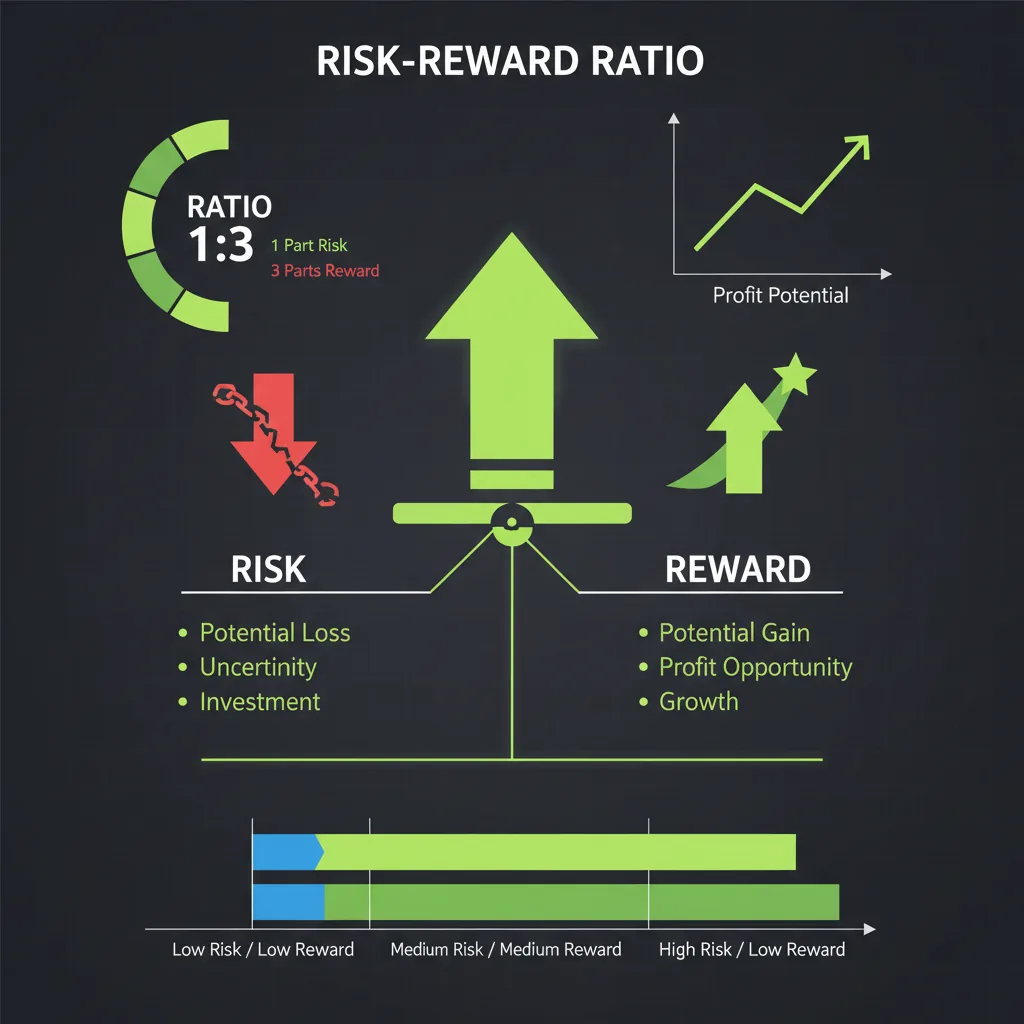
The risk reward ratio isn't merely a metric; it's a foundational principle for every profitable trader. It defines your trading philosophy. You quantify the potential loss against the potential profit for any given trade. This simple calculation brings clarity to your decision-making process, moving you from hopeful speculation to strategic execution.
#### Defining Your Edge: What R:R Truly Means
Your edge in the market doesn't come from predicting every move. It comes from managing probabilities. The risk reward ratio is the mathematical representation of this management. A 1:2 ratio means you expect to gain twice as much as you risk. A 2:1 ratio means you risk twice as much as you expect to gain. You decide what balance makes sense for your strategy and your capital.
#### Calculation is Simple. Application is Key.
Calculating your risk reward ratio is straightforward. You identify your entry price, your stop loss level (maximum acceptable loss), and your take profit level (target gain). The difference between your entry and stop loss is your risk. The difference between your entry and take profit is your reward. Divide your reward by your risk. That's your ratio.
You can even conceptualize this in Pine Script. While full strategy logic is more complex, the core calculation is clear:
\\\`pine
//@version=5
indicator("Simple Risk Reward Calculator", overlay=true)
// User inputs for potential stop loss and take profit levels (in price units)
// Adjust these values to simulate different trade setups
potentialStopLossPrice = input.float(1.0650, "Potential Stop Loss Price (e.g., EURUSD)")
potentialTakeProfitPrice = input.float(1.0850, "Potential Take Profit Price (e.g., EURUSD)")
currentEntryPrice = close // Assume current close is potential entry for demonstration
// Calculate the 'risk' in price units
risk = math.abs(currentEntryPrice - potentialStopLossPrice)
// Calculate the 'reward' in price units
reward = math.abs(potentialTakeProfitPrice - currentEntryPrice)
// Calculate the Risk Reward Ratio
// Ensure risk is not zero to avoid division by zero errors
riskRewardRatio = risk != 0 ? reward / risk : 0
// Display the ratio on the chart's data window
plot(riskRewardRatio, "Calculated R:R", color.blue)
// Optional: Display levels on chart for visual reference
plot(potentialStopLossPrice, "SL", color.red, style=plot.style_circles, linewidth=2)
plot(potentialTakeProfitPrice, "TP", color.green, style=plot.style_circles, linewidth=2)
plot(currentEntryPrice, "Entry", color.orange, style=plot.style_line, linewidth=2)
\\\`
This script helps you visualize the components of your risk reward ratio directly on your chart, making the concept tangible. You define these levels; the market reacts. Your strategy must account for both.
Beyond the 1:2 Myth: Finding Your Optimal R:R
The market often touts 1:2 or 1:3 as the ideal risk reward ratio. This is a generalization, not a universal truth. Your optimal ratio depends entirely on your strategy's win rate and the market you trade. You must find *your* balance, not someone else's.
#### Win Rate vs. Risk Reward: A Necessary Balance
Your win rate and your risk reward ratio are intrinsically linked. A high win rate can sustain a lower risk reward ratio. Conversely, a lower win rate *demands* a higher risk reward ratio to remain profitable. You cannot ignore one in favor of the other. You must consider both in tandem.
Consider this comparison:
This table illustrates a critical point: a high win rate with a poor risk reward ratio can be less profitable than a moderate win rate with a strong risk reward ratio. You must validate these combinations through rigorous backtest analysis.
#### Adapting R:R to Different Markets and Strategies
Volatility dictates appropriate risk reward ratios. Trading gold strategies often involves different price action than forex vs crypto pairs. A scalping strategy might prioritize a high win rate with a 1:1 or even slightly less than 1:1 ratio, relying on volume. A trend-following strategy, however, often accepts a lower win rate in exchange for significantly higher risk reward ratios, capturing large moves.
You adapt your risk management, not just your entry signals. For example, our BTCUSD swing strategy boasts a +124.6% return with a 62.8% win rate and a Sharpe of 2.14. This performance is a direct result of meticulously balancing win rate with an appropriate risk reward ratio, ensuring that winning trades significantly outweigh losing ones in magnitude.
Implementing R:R with Algorithmic Precision
Human emotion is the enemy of consistent risk reward application. You set a stop loss and take profit, but the market's noise tempts you to move them. Algorithmic trading removes this variable. You define your rules, and the machine executes them without hesitation.
#### Automating Stop Loss and Take Profit
Automating your stop loss and take profit levels ensures your predefined risk reward ratio is respected on every trade. This is where trading bots excel. You program the bot to exit at specific price points, eliminating the psychological pressure to hold onto losers or cut winners short. Your Pine Script guide is the first step to mastering this automation.
#### Backtesting Your Risk Reward Assumptions
Never assume your chosen risk reward ratio will work. You must validate it. Backtest your strategy across various market conditions, symbols, and timeframes. PineForge provides the environment for this critical validation. You see how different risk reward settings impact your total return, drawdowns, and overall profitability. This data-driven approach removes guesswork; you trade with conviction, not hope.

How Does Risk Reward Ratio Impact My Profitability?
Your profitability is directly tied to your risk reward ratio and your win rate. A high win rate with a low risk reward (e.g., 80% win rate, 1:0.5 R:R) can be profitable, but each loss costs you double a win. A low win rate with a high risk reward (e.g., 30% win rate, 1:4 R:R) can also be profitable, as winning trades more than compensate for frequent small losses. The key is to find a combination where your expected value per trade is positive. You control this balance. You define the parameters that lead to long-term gains, not just short-term luck.
Can a Low Win Rate Strategy Be Profitable with a Good R:R?
Absolutely. Many trend-following or breakout strategies inherently have lower win rates. They aim to capture infrequent, large moves. For these strategies to be profitable, they *must* have a high risk reward ratio. You accept many small losses, knowing that a single winning trade can cover multiple losing ones and still generate substantial profit. This requires discipline and robust risk management. The XAUUSD EMA strategy, for instance, delivered +87.4% return with a 74.2% win rate and a 2.31 profit factor – demonstrating a strong profitable edge where the R:R was clearly favorable.
What's a "Good" Risk Reward Ratio?
There is no single
| Scenario | Win Rate | Risk Reward Ratio | Expected Value per Trade (Normalized) |
|---|---|---|---|
| A | 70% | 1:1 | (0.7 * 1) - (0.3 * 1) = 0.4 |
| B | 50% | 1:2 | (0.5 * 2) - (0.5 * 1) = 0.5 |
| C | 30% | 1:4 | (0.3 * 4) - (0.7 * 1) = 0.5 |
| D | 40% | 2:1 | (0.4 * 1) - (0.6 * 2) = -0.8 |
Start Trading Smarter
Build, backtest, and deploy your strategies with PineForge. No coding experience required.