Profit Factor vs Win Rate: The Metric That Actually Predicts Bot Profitability
PineForge Team
Automated Trading Platform
A 70% win rate sounds incredible. A 2.0 profit factor sounds like jargon. So most retail traders chase the first number and ignore the second — and lose money to a strategy that wins seven times out of ten.
This article explains why profit factor is the metric that actually predicts whether your bot will make money over time, why win rate alone is one of the most misleading numbers in all of trading, and how to read both of them correctly the next time you look at a backtest.
What Is Profit Factor (and Why It's Hard to Fake)
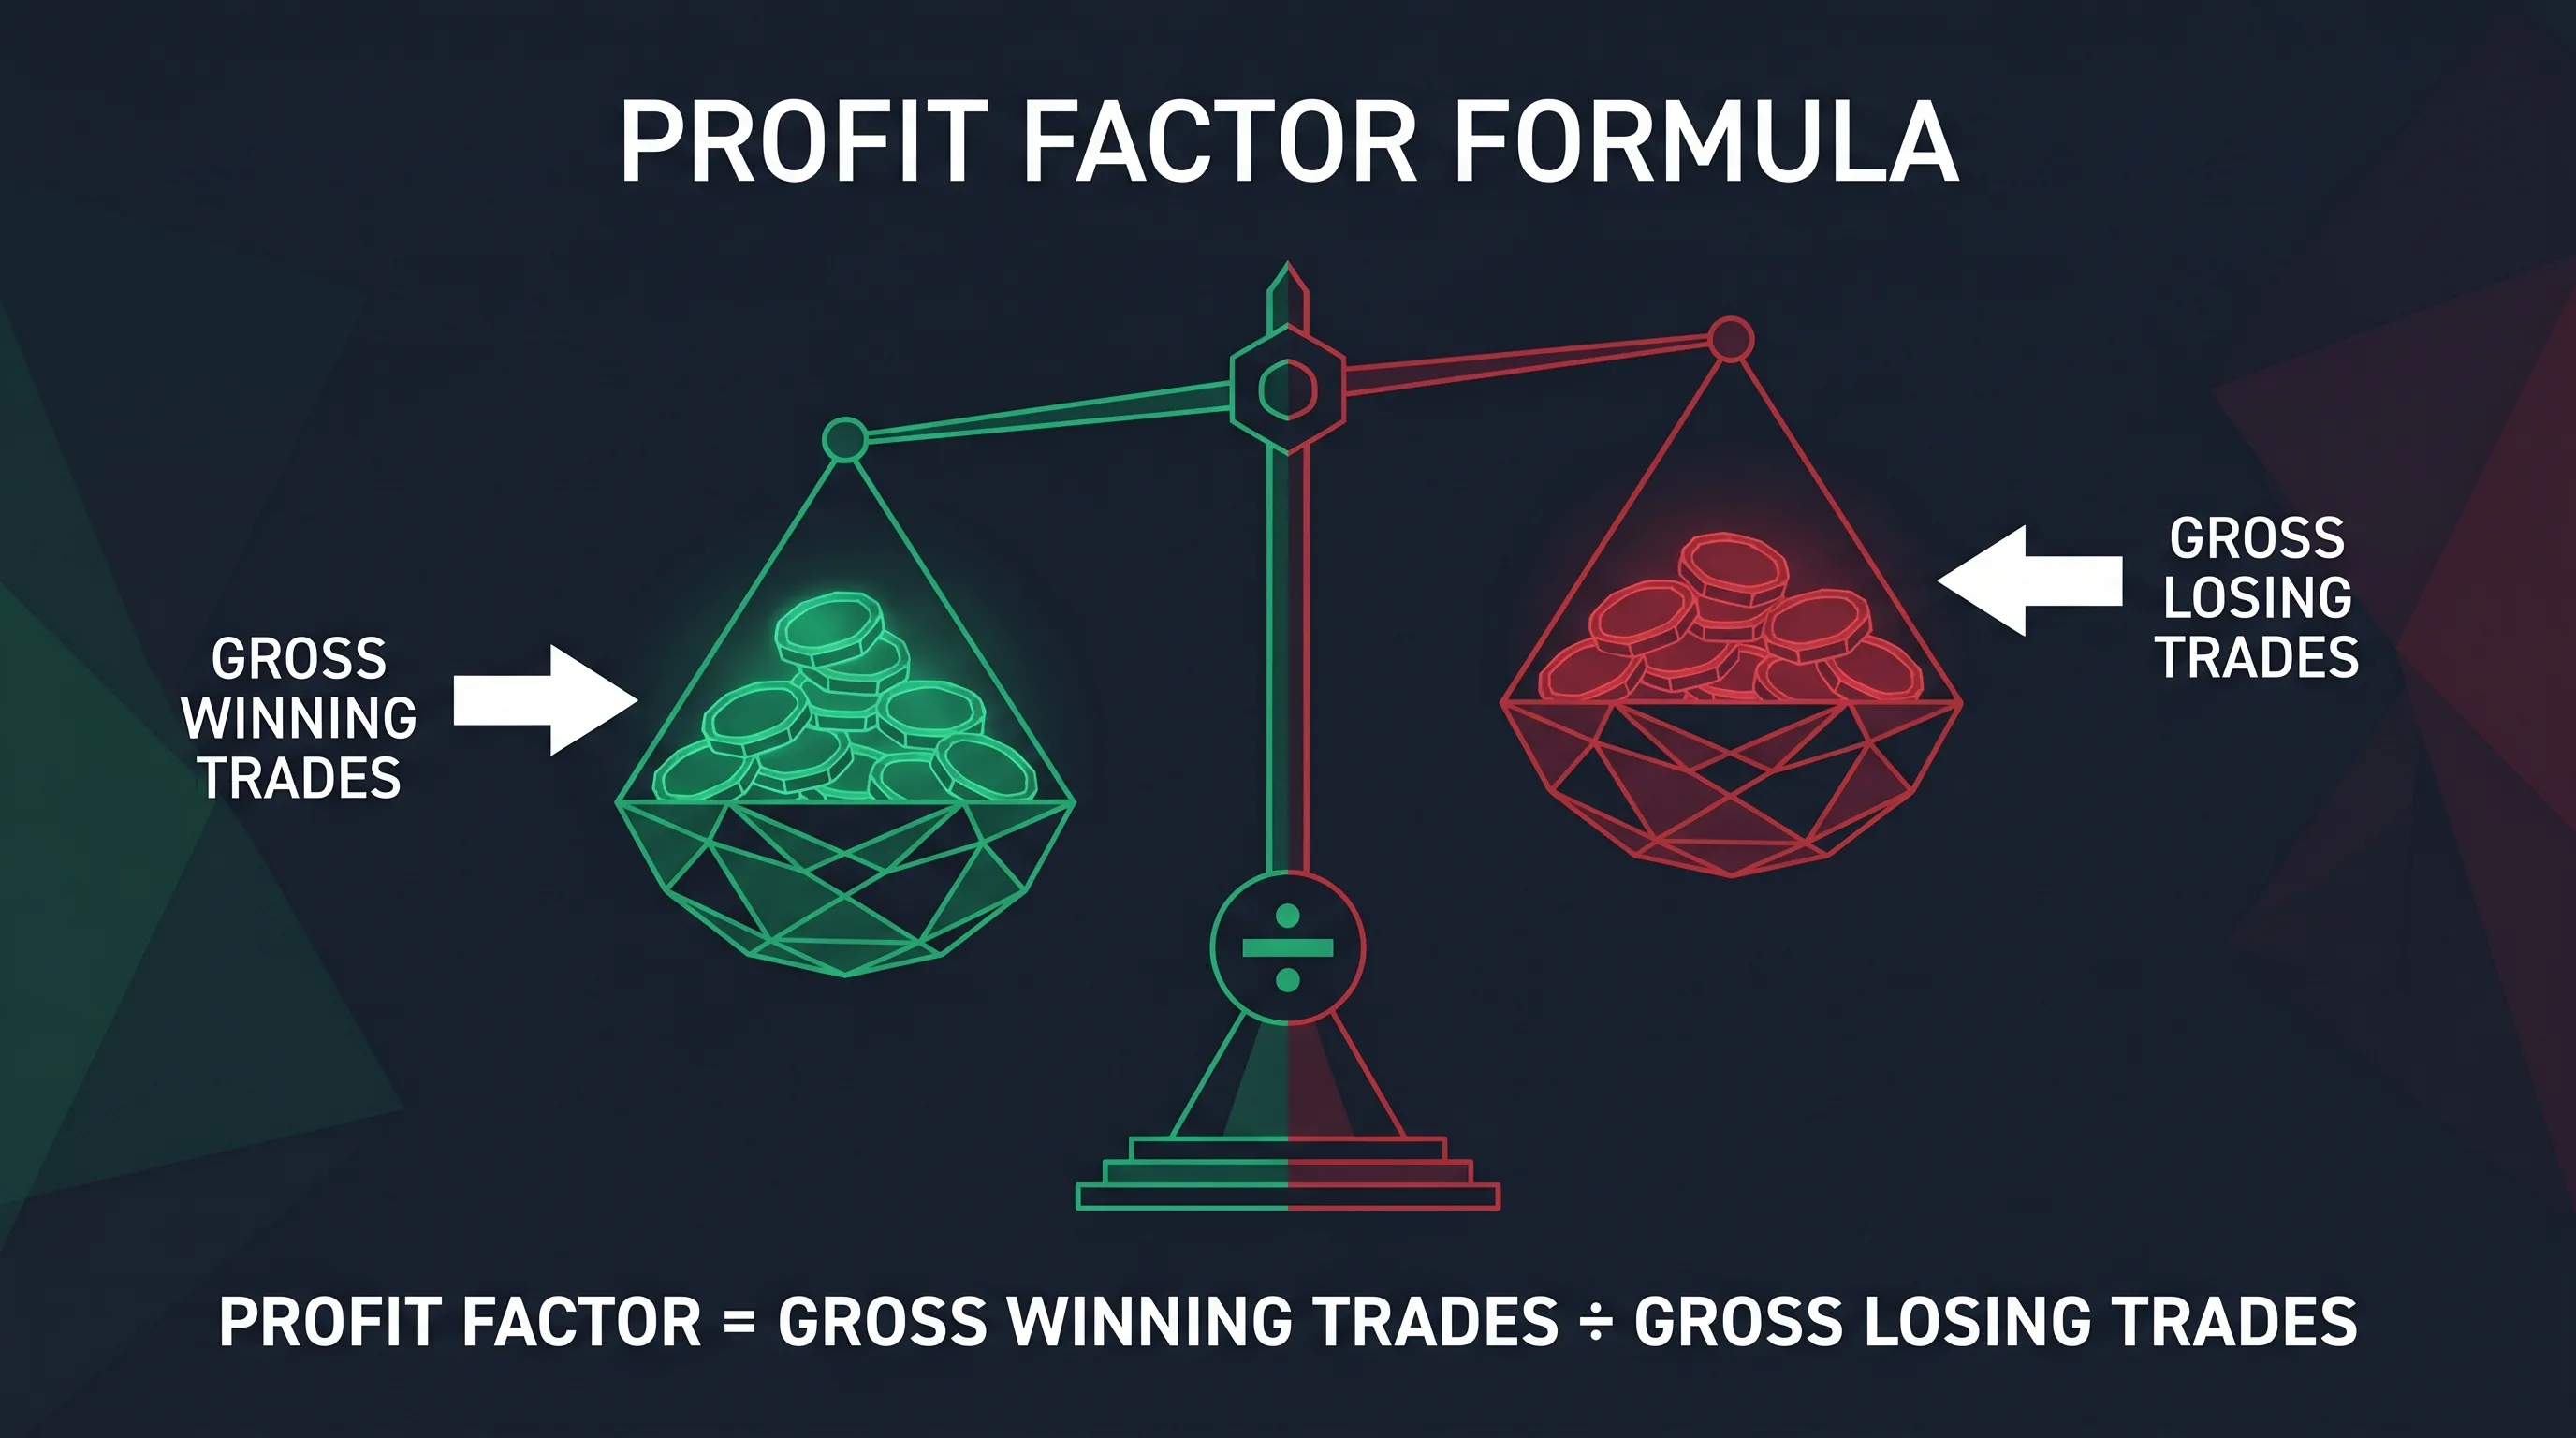
Profit factor is a single number that captures whether your strategy makes more money on its winners than it loses on its losers. The formula is:
Profit Factor = Gross Winning Trades ÷ Absolute Value of Gross Losing Trades
If your strategy made $5,000 across all winning trades and lost $2,500 across all losing trades, your profit factor is 2.0. You earned two dollars for every one you gave back.
What the Numbers Mean in Practice
Why Profit Factor Is Hard to Fake
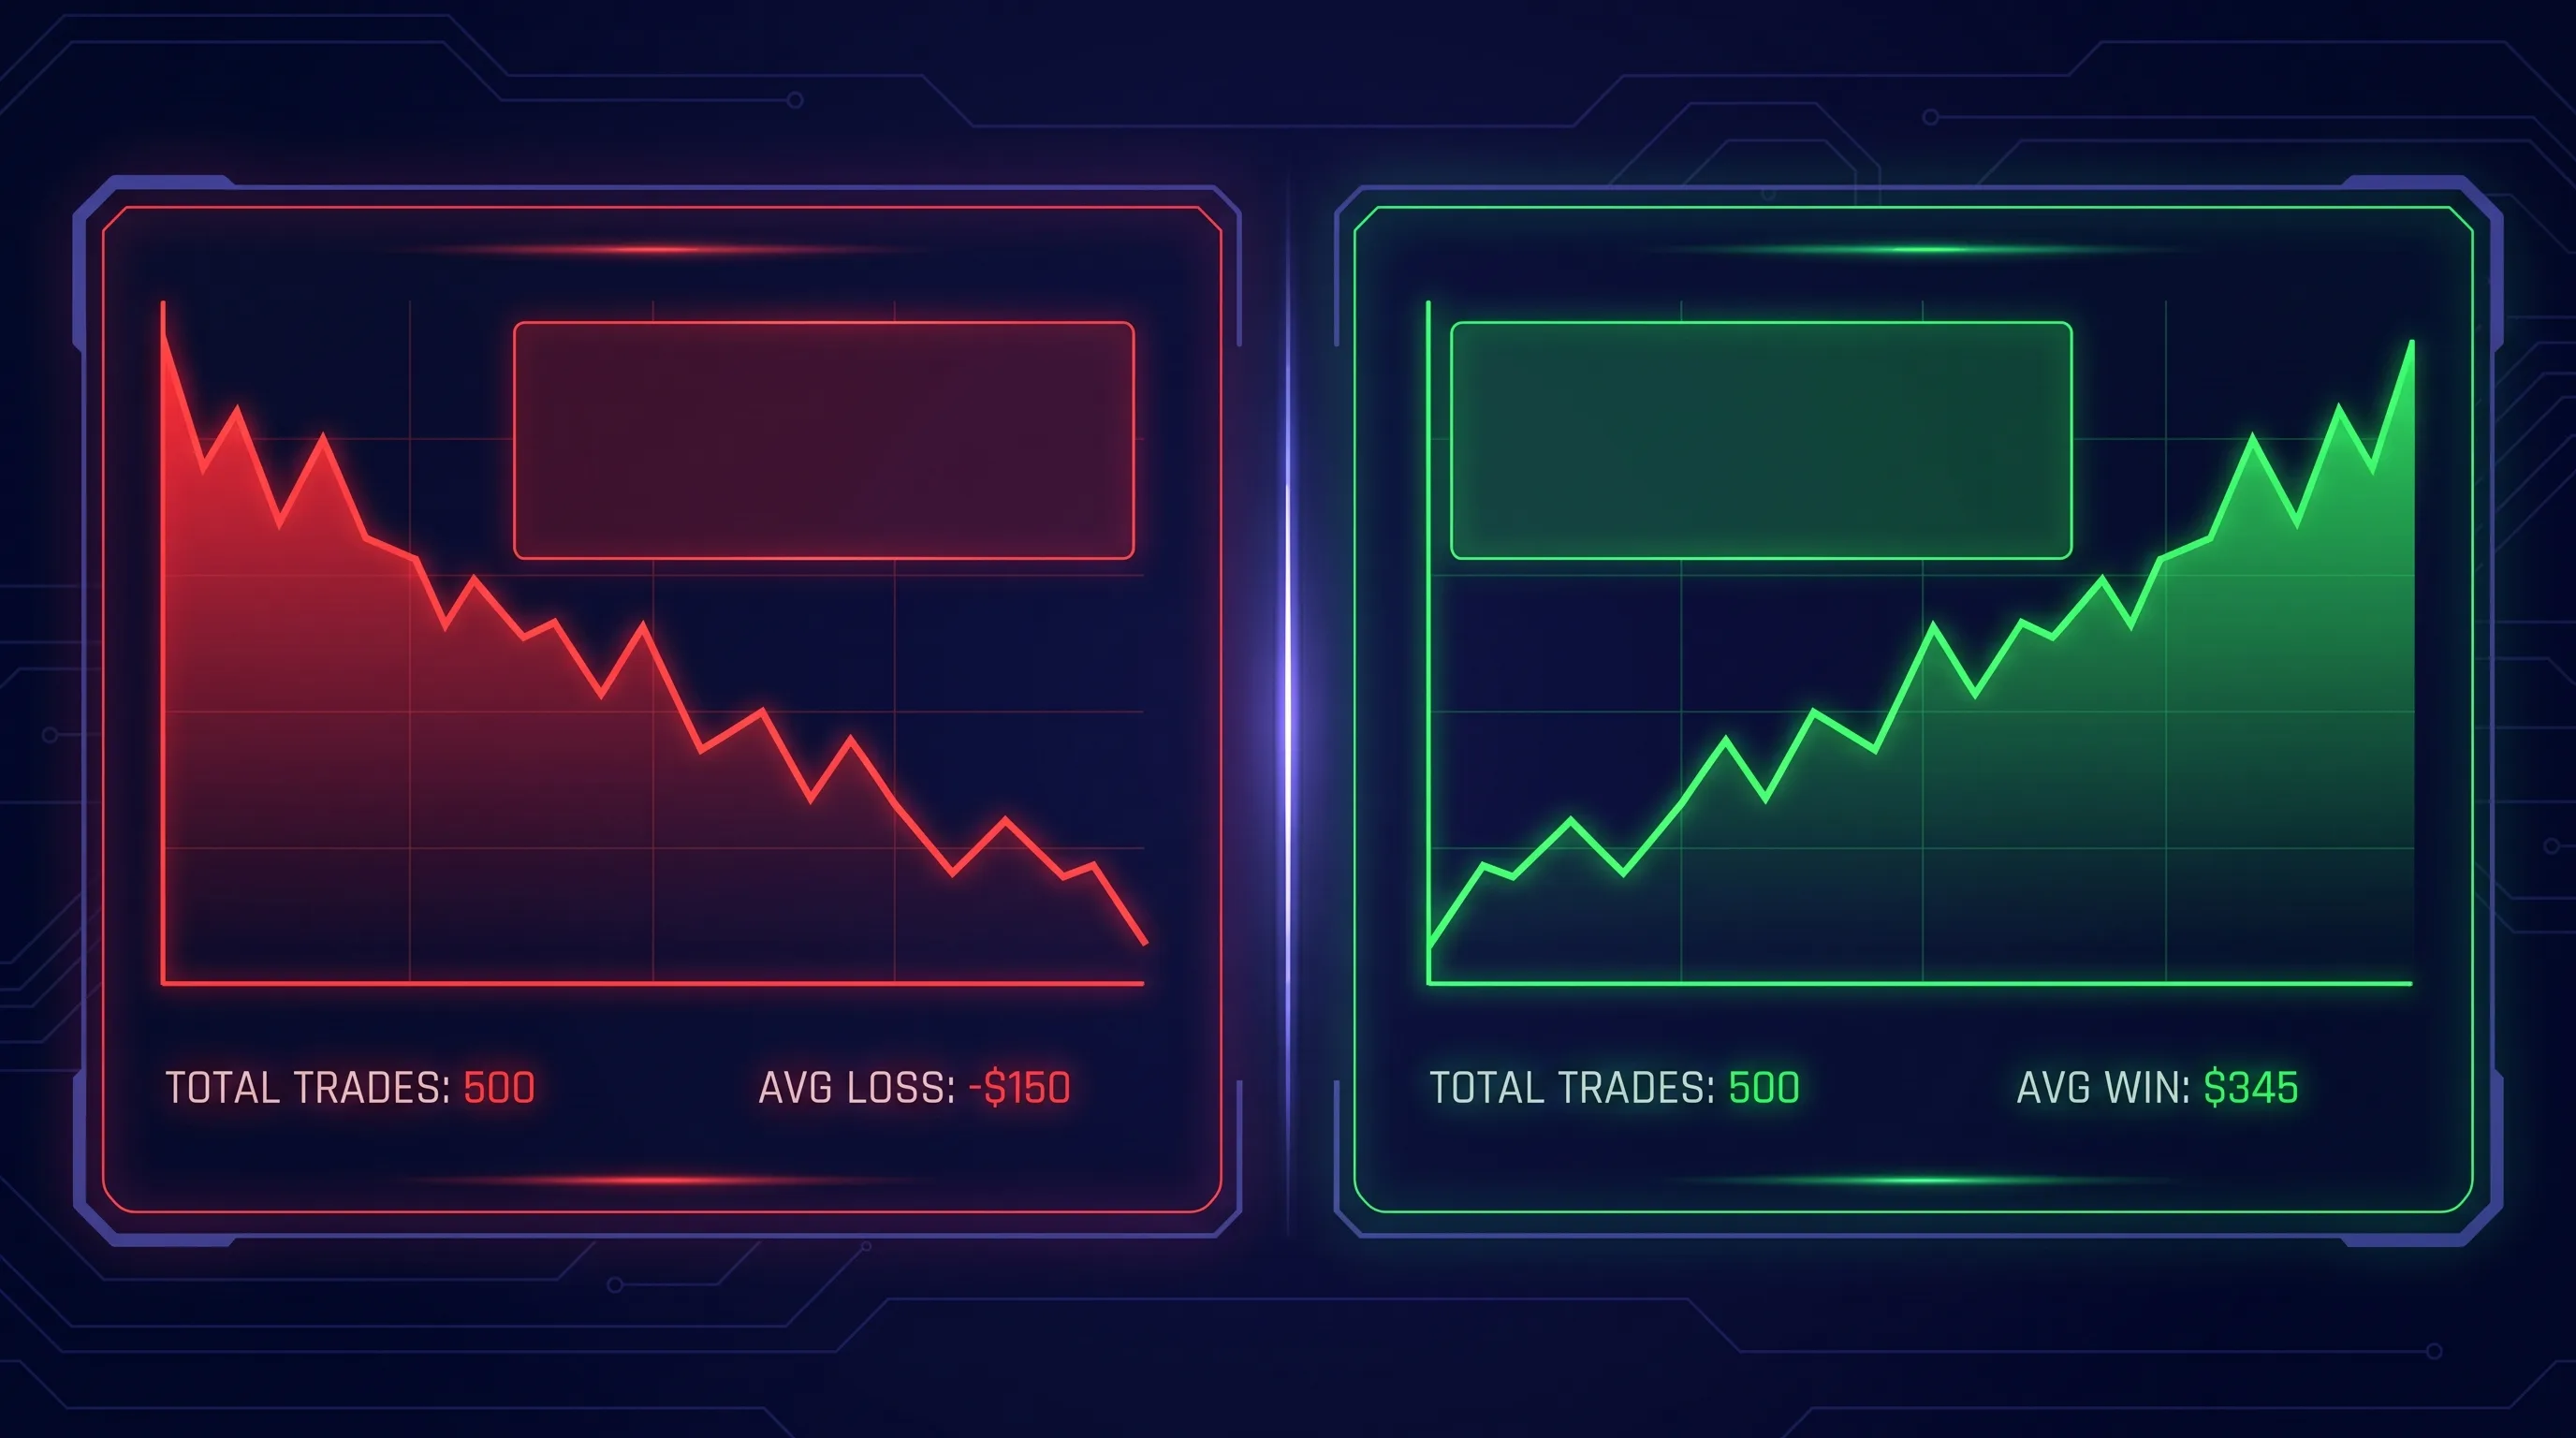
You can manufacture a high win rate by closing every trade quickly with a tiny gain — the "snowflake" strategy. But the moment a few trades go against you, the loss tax dwarfs all the small wins. Profit factor catches this immediately because it weighs the dollar magnitude of wins against losses, not the count.
A strategy with a 95% win rate and a 0.4 profit factor is bleeding money — the 5% of losses are wiping out the 95% of wins. Profit factor surfaces this in one number.
Why Win Rate Alone Tells You Almost Nothing
Win rate measures how many trades closed in profit out of total trades. A 70% win rate means seven out of ten trades made money. Sounds great. It isn't.
The Snowflake Trap
A common entry-level strategy: enter on every signal, take a 5-pip profit, close on a 50-pip stop. You'll win 80%+ of the time because the small target is easy to hit. But every loser wipes out ten winners. After a normal market drawdown, the account is gone.
This is why high-win-rate strategies are dangerous for new traders. The pattern is intuitive (winning often *feels* like winning) but the math is unforgiving (you're just front-loading wins and back-loading the bankrupting loss).
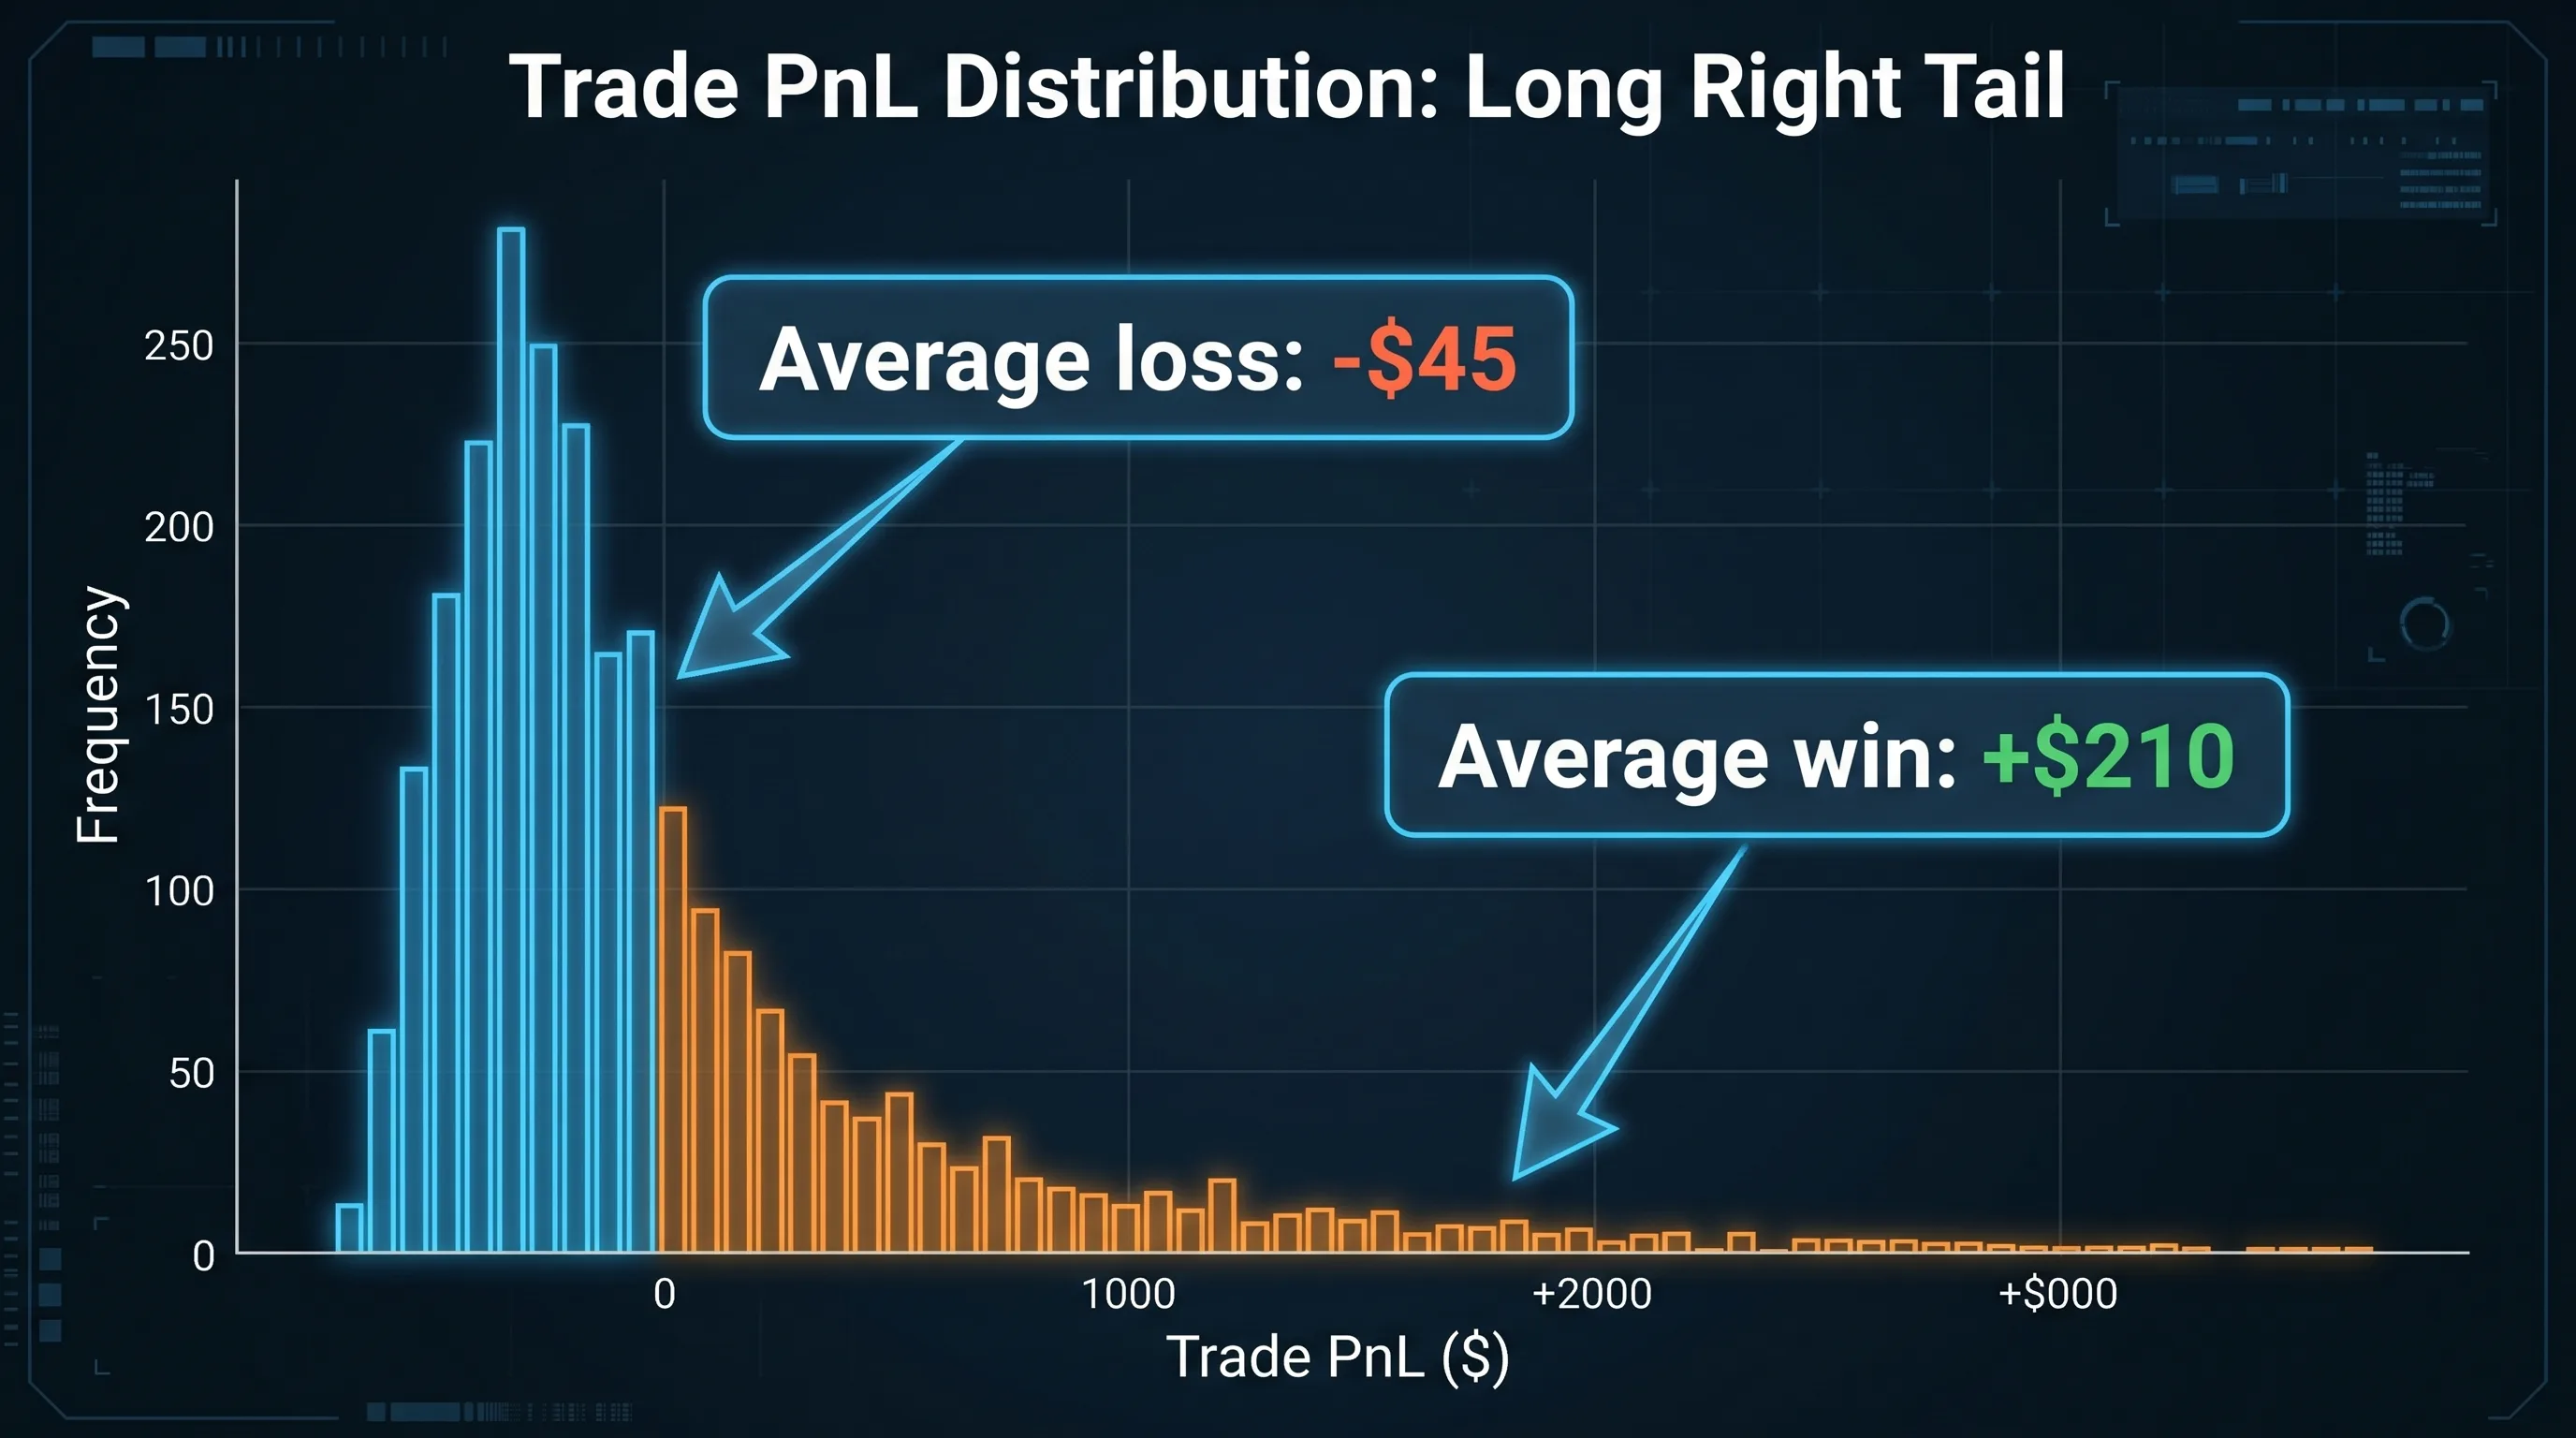
The Reverse Pattern: Low Win Rate, High Profit Factor
Trend-following strategies win 35-45% of the time, but their winners run 3-5x larger than their losers. The Turtle Traders, Renaissance Medallion, and most managed-futures funds operate at sub-50% win rates with profit factors above 2.0. They lose more often than they win, and they're some of the most profitable systems ever deployed.
If you only looked at win rate, you'd reject these strategies as broken. The profit factor tells you they're not.
Reading Win Rate and Profit Factor Together
The two numbers must always be read as a pair. Here's how the four combinations actually behave.
The most dangerous combination for retail traders is high win rate + low profit factor. It feels like a winning system because most days end in green. The loss is concentrated in a handful of catastrophic trades — usually after a drawdown the trader didn't think possible.
How Big Should the Gap Between Average Win and Average Loss Be?
Pair win rate with the average win to average loss ratio. If your average winner is $200 and your average loser is $100, that's a 2:1 ratio — you only need a 35% win rate to be profitable. If your average winner is $50 and your average loser is $300, you need an 86% win rate just to break even.
PineForge's backtest engine shows both numbers in the metrics panel. Always cross-check them before celebrating a high win rate.
A Real-World Worked Example
Take a real Gold Trend Hunter V2 backtest on XAUUSD 1H from a recent run on PineForge:
A retail trader staring at the 48.95% win rate would say "this strategy doesn't work — it loses more than half its trades." A professional would look at the 2.09 profit factor and say "this strategy is right at the edge of viable, but the negative Sharpe and 37% drawdown reveal it's heavily reliant on a few outsized winners during a trending year."
Same backtest, two completely different reads. The professional read is the correct one — and you only get there by reading profit factor and win rate together, not in isolation.
For a deeper walkthrough of the metrics that matter for gold strategies, see our backtest gold trading bot guide.
What Profit Factor Doesn't Tell You
Profit factor isn't a complete metric. Don't deploy a strategy on profit factor alone — pair it with:
A strategy is only ready for live trading when all of these check out. Profit factor is the headline metric — the others are the fine print that prevents a disaster. Read our risk management guide for how to size positions and limit catastrophic losses.
Is a 1.5 Profit Factor Good Enough to Trade Live?
For most retail traders on most strategies, yes — provided your max drawdown is under 20% and you have a sample of 100+ trades. The reason: live trading degrades backtest performance by 10-20% on average due to slippage, spread, and execution delay. A 1.5 profit factor in a backtest typically becomes 1.3 in live, which is still profitable. A 1.2 profit factor in a backtest typically becomes 1.0 or below — exactly break-even or losing.
If your strategy backtests at 1.2, don't deploy it. Iterate.
How Do I Improve My Profit Factor?
Three levers, in order of impact:
Conclusion
Win rate is the number that gets shouted in marketing screenshots. Profit factor is the number that determines whether your account grows. Read them together, weight them honestly, and never trust a single metric in isolation.
Three takeaways. First, profit factor catches the mathematical reality that win rate hides — you can win 90% of the time and still lose money. Second, low win rate combined with high profit factor is a feature, not a bug, of trend-following systems. Third, no metric is sufficient on its own — pair profit factor with drawdown, Sharpe, and trade count before you deploy.
Run a backtest on PineForge and read the metrics the way professionals do — gross profit divided by gross loss, with eyes wide open.
| Profit Factor | Interpretation |
|---|---|
| Below 1.0 | Strategy loses money. Don't deploy. |
| 1.0 – 1.3 | Marginal. Costs (spread, slippage) will kill it. |
| 1.3 – 1.5 | Acceptable. Survivable in live trading. |
| 1.5 – 2.0 | Solid. Most professionally managed strategies live here. |
| Above 2.0 | Excellent. Be skeptical — verify it's not overfit. |
| Above 3.0 | Almost certainly overfit or look-ahead bias. |
| Win Rate | Profit Factor | Verdict |
|---|---|---|
| High (60%+) | High (>1.5) | Strong system. Verify no overfit. |
| High (60%+) | Low (<1.3) | Snowflake trap. Wins are tiny, losses are huge. |
| Low (<50%) | High (>1.5) | Trend-follower. Few big wins offset many small losses. |
| Low (<50%) | Low (<1.3) | Strategy doesn't work. Move on. |
Start Trading Smarter
Build, backtest, and deploy your strategies with PineForge. No coding experience required.