How to Backtest a Gold Trading Bot on the 1-Hour Timeframe (XAUUSD Walkthrough)
PineForge Team
Automated Trading Platform
Most gold strategies look brilliant on paper and bleed money live. The gap is almost always sloppy backtesting — wrong timeframe, not enough data, overfit logic, or a misread of the metrics. You don't need a PhD to fix this. You need a repeatable workflow.
This guide walks you through how to backtest a gold trading bot on the 1-hour timeframe (XAUUSD), end to end. You'll learn why 1H is the sweet spot for gold, what data and metrics actually matter, and how to run the test on PineForge in under five minutes. Every strategy needs a proper backtest before going live — and gold is the market that punishes shortcuts the hardest.
By the end, you'll know whether your gold strategy has an edge, or whether it's just lucky.
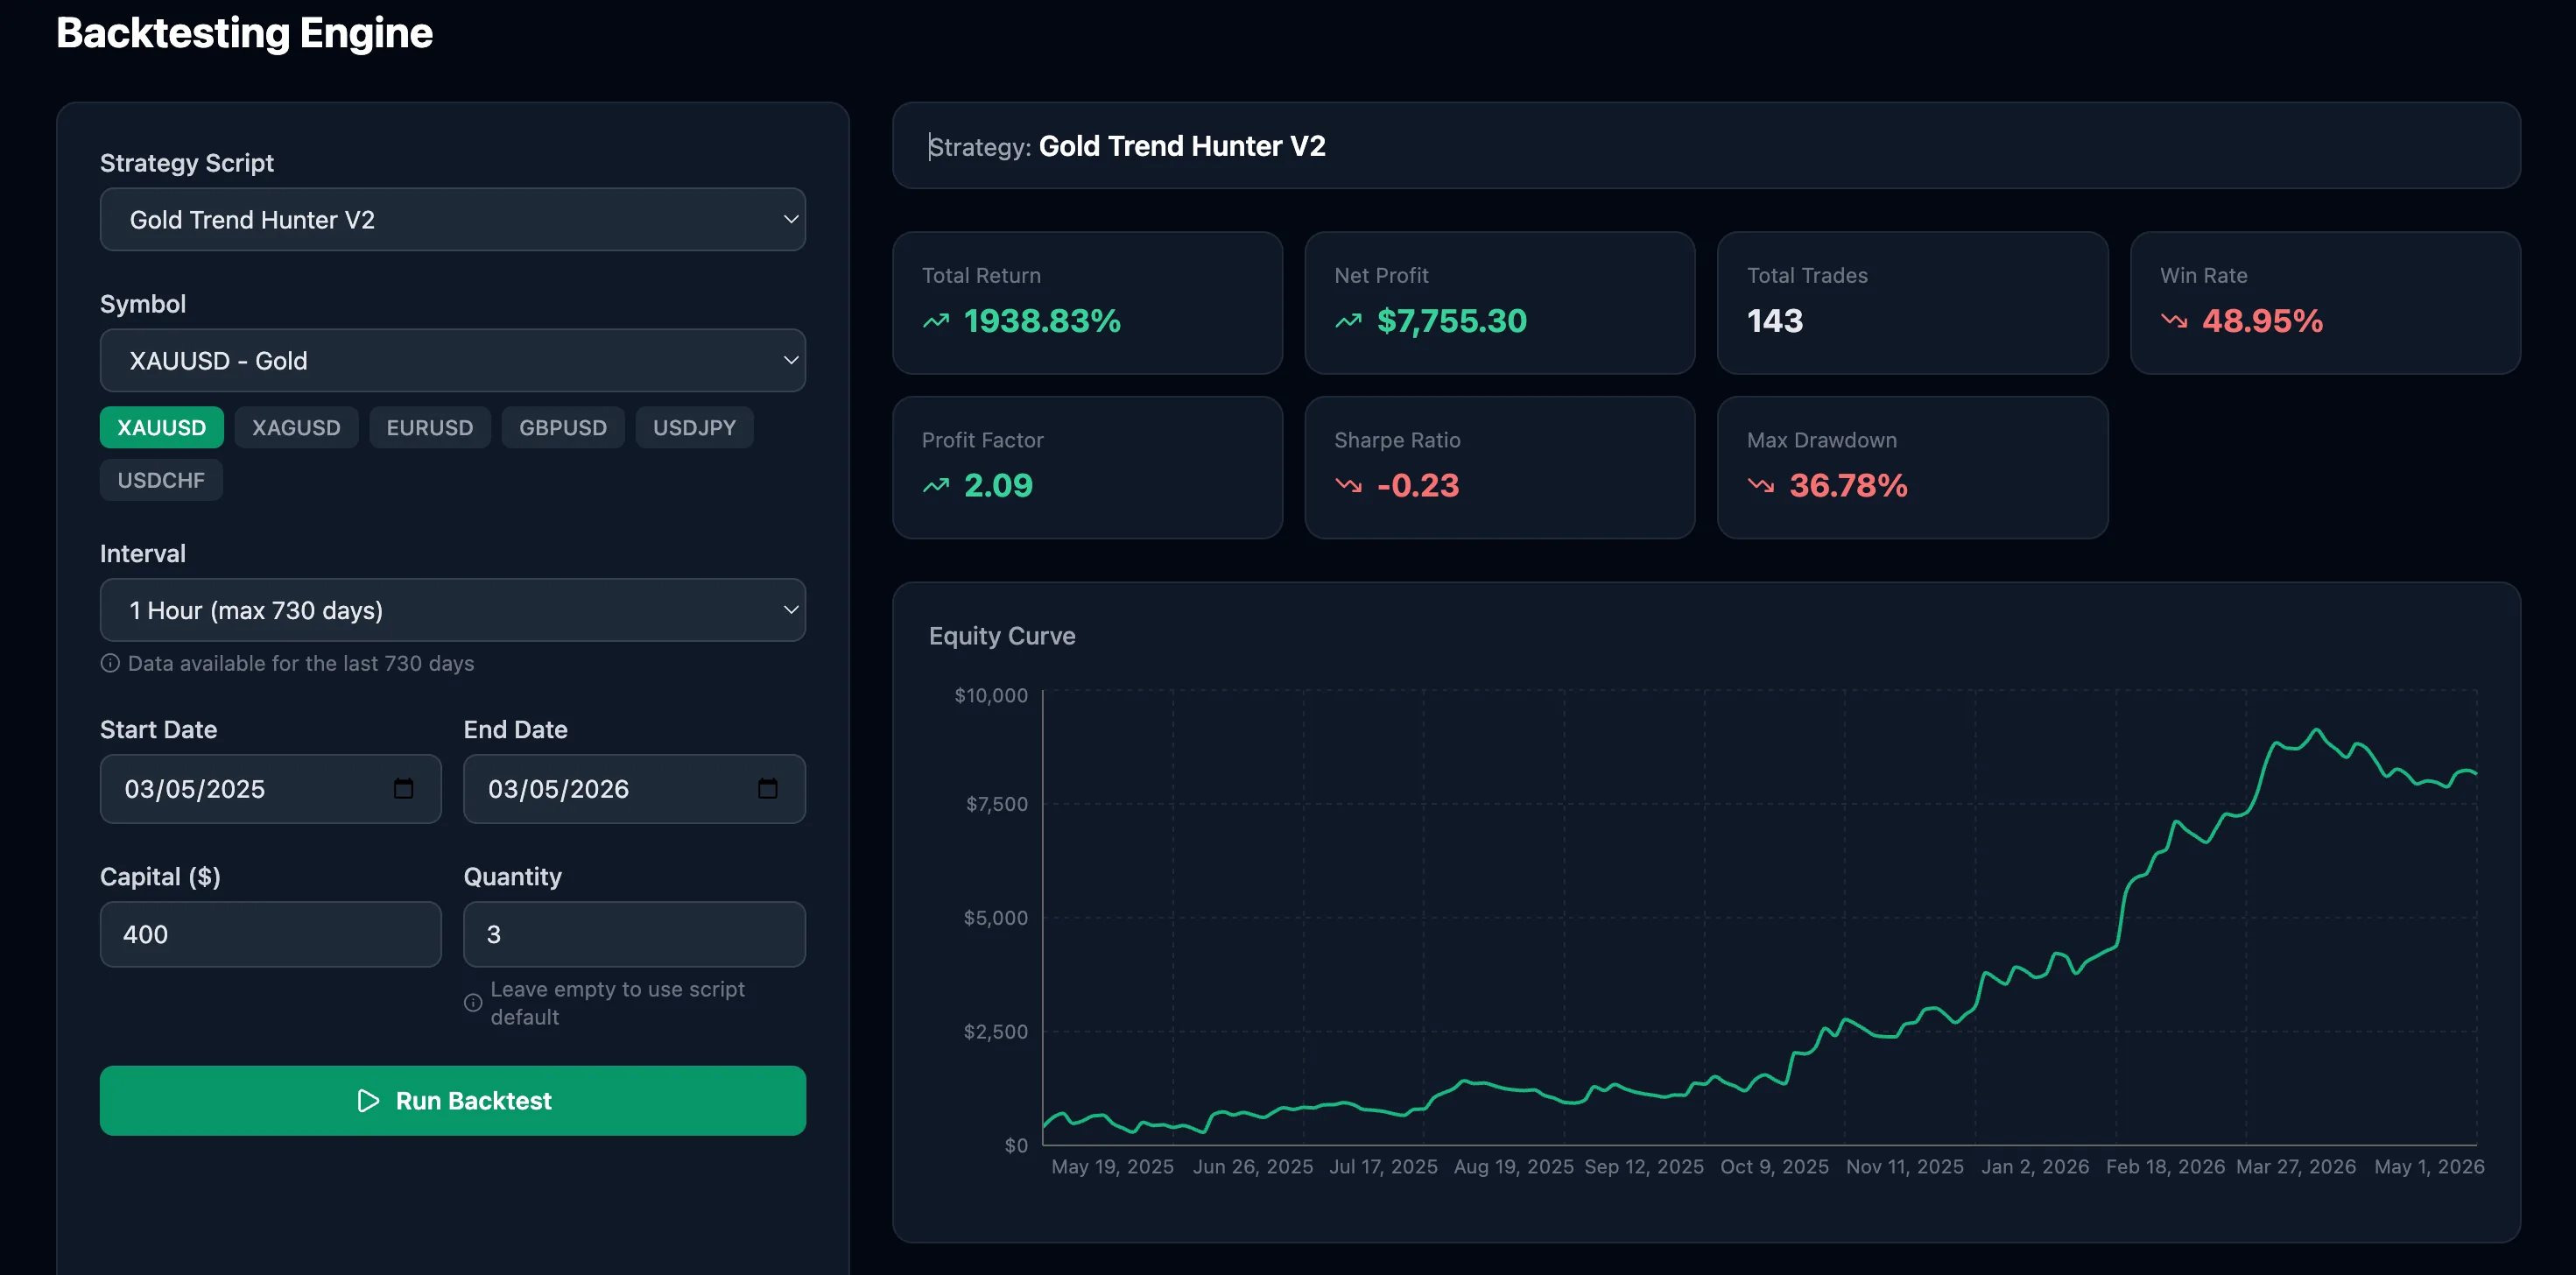
Look at the screenshot above before you read another word. Gold Trend Hunter V2, XAUUSD, 1-hour timeframe, 12 months of data, $400 starting capital. The headline number is +1938.83% return and $7,755 net profit on a $400 account. Eye-popping. But scroll down: win rate 48.95%, Sharpe ratio −0.23, max drawdown 36.78%. By the end of this guide you'll know exactly why a return that big with a Sharpe that bad is a warning, not a green light — and how to backtest a gold trading bot in a way that surfaces this kind of contradiction in seconds.
Why the 1-Hour Timeframe Wins for Gold (XAUUSD)
Gold is one of the most-traded instruments on the planet, but its character changes dramatically across timeframes. Pick the wrong one and your backtest tells you nothing.
Gold's Intraday Volatility Profile
Gold moves in waves driven by London and New York liquidity. The 1-hour timeframe captures full price swings without drowning you in noise. According to the World Gold Council's market research, gold's average daily range routinely exceeds $20 — enough to produce meaningful 1H bars with clear structure, but not so granular that every wick becomes a signal.
Where 5M and 15M Strategies Break
Lower timeframes look tempting — more bars, more trades, faster results. They also amplify the costs you can't escape: spread, slippage, and broker execution latency. A strategy that earns $1.20 per trade on 5M data eats $0.80 in transaction costs and dies on a live account. The 1H timeframe widens your average move enough that costs become a smaller percentage of every trade.
Why 4H and Daily Miss the Move
The opposite problem appears on higher timeframes. A 4H bar locks in eight hours of structure too late for tactical entries. Daily charts can deliver three trades a month — too few to validate a strategy statistically. The 1-hour timeframe sits in the sweet spot: enough trades for statistical confidence, enough range to overcome costs, and slow enough that broker execution doesn't dominate the result.
What You Need Before You Backtest
Before you run a single backtest, get these four things in order. Skip any of them and your result is fiction.
A Working Pine Script `strategy()` Script
PineForge runs Pine Script — the same language used across modern strategy platforms. Critically, it must be a `strategy()` script, not an `indicator()`, because only strategies contain entry and exit logic that can be simulated. New to Pine? Start with our Pine Script guide for beginners and you'll have a working script in 10 minutes.
Clean OHLC Data With Enough Warmup
Every indicator needs warmup bars before it produces a valid signal. A 200-period EMA needs 200 bars of price history before the first reading is real. PineForge automatically fetches roughly 200 bars before your start date so your strategy enters the test fully warmed — no false signals at the start that distort your results.
A Starting Capital That Mirrors Your Real Account
Backtest with the capital you'll actually trade. A strategy that wins on $100,000 of paper capital can blow up on $1,000 because lot sizes and drawdown tolerance scale differently. If you'll deploy the bot on a $5,000 Exness account, run the backtest on $5,000.
A Timeframe-Appropriate Date Range
For 1H gold, you want at least 12 months of data — ideally 18 to 24. One year of pure trend (like 2024's gold rally) flatters every long-biased strategy and tells you nothing about how it behaves in a range. Multiple market regimes are how you separate skill from luck.
Step-by-Step: Backtesting Gold on the 1H Timeframe in PineForge
Here's the exact workflow on PineForge's backtest engine. Five steps, five minutes.
Step 1 — Pick or Upload a Gold Strategy
Open the Strategies page. Either choose a pre-built strategy from the library — PineForge ships proven gold strategies including Gold Trend Hunter V2, EMA Crossover, and RSI Mean Reversion — or upload your own .pine file. The platform validates the script before it lets you run a backtest, catching syntax errors early.
If you need ideas, our roundup of top gold trading strategies for 2026 breaks down what works on XAUUSD and why.
Step 2 — Configure Symbol, Interval, and Capital
In the backtest dialog, set:
The interval dropdown maps directly to the timeframe in your Pine Script. Picking 1H here tells the engine to feed your strategy 1-hour OHLC bars — no resampling tricks, no weird interpolation.
Step 3 — Set the Date Range
For 1H gold, 12 to 24 months is the right window. Start with the last full year. PineForge handles warmup automatically — you'll see fewer trades reported than the engine actually simulated, because trades that opened during warmup are excluded from results so they don't pollute your stats.
Step 4 — Run and Read the Equity Curve First
Hit Run. Results return in seconds. Before you look at any number, look at the equity curve.
A healthy backtest has a curve that climbs steadily with shallow drawdowns. A red flag is a curve that's flat for nine months and then explodes upward — that's almost always one lucky trade or a bug in your script. Smooth, boring growth beats spectacular spikes every time.
Step 5 — Drill Into the Metrics
Once the curve looks reasonable, examine the metrics panel: total return, win rate, profit factor, max drawdown, Sharpe ratio, and the full trade list. Each one tells you something different about your strategy's quality — and they only mean something together.
The Five Metrics That Actually Tell You If a Gold Bot Works
Most beginners obsess over win rate. Most professionals barely look at it. Here's what to read, in order.
Profit Factor — The Number That's Hard to Fake
Profit factor is gross winning trades divided by gross losing trades. Above 1.0 is profitable. Above 1.5 is solid. Above 2.0 is exceptional and rare. As Investopedia explains, a strategy can have a 90% win rate and still lose money if the average loss dwarfs the average win — profit factor catches this immediately.
Max Drawdown — Your Tolerance, Not the Average's
Max drawdown is the largest peak-to-trough equity decline during the backtest. If a strategy posts a 60% return with a 35% max drawdown, ask yourself honestly: would you have stayed in it through a 35% loss? Most traders couldn't, and they bail at the worst moment. A 30% return with 8% max drawdown is a better real-money strategy than a 60% return with 35%.
Sharpe Ratio — Risk-Adjusted, Not Absolute
The Sharpe ratio measures excess return per unit of volatility. A 1.0 Sharpe is acceptable. Above 1.5 is good. Above 2.0 is institutional-grade. Sharpe is what separates a strategy that grinds out steady returns from one that's secretly a coin flip.
Win Rate vs Average Win/Loss — The Trap
Win rate alone is meaningless. A 40% win rate with a 3:1 reward-to-risk ratio crushes a 70% win rate with a 1:2 reward-to-risk ratio. Always read win rate alongside the average win and average loss columns. In our Gold EMA Crossover backtest, the strategy posted a 74% win rate with a 2.31 profit factor over 156 trades on the 1H timeframe — those numbers reinforce each other instead of contradicting.
Trade Count — Statistical Significance
Thirty trades is the bare minimum to take any backtest seriously. A hundred trades or more gives you real confidence. If your 1H gold backtest only produced 18 trades over a year, your strategy is too rare to validate — or you backtested too short a window. Either expand the date range or rethink the entry logic.
Reading the Screenshot Above, Honestly
Now go back to the hero screenshot and read it the way a professional would. Total return: 1938%. That headline is *real* — the equity curve grew $400 to roughly $8,000. But the underlying numbers tell a more complicated story. Sharpe ratio −0.23 means the strategy returned less than a risk-free asset would have, on a risk-adjusted basis — most of that 1938% came from accepting volatility most retail traders couldn't stomach. Max drawdown 36.78% means there was a moment in the test where the account fell 37% from its peak — would you have stayed in? Win rate 48.95% with a profit factor of 2.09 is actually fine in isolation (a few big winners covered a lot of small losers), but combined with the negative Sharpe, the equity curve also peaked higher than it ended — meaning you'd have to time your entry into the strategy itself perfectly. This is exactly the contrast the post is built around. A clean backtest doesn't just tell you the return — it tells you what you'd have lived through to capture it.
How Long Should I Backtest a Gold Strategy On?
For 1H gold, 12 months minimum, 24 months ideal. Anything less and you risk overfitting to a single market regime. Gold tends to alternate between strong directional years (2020, 2024) and choppy ranges (2018, 2021). A strategy that only works in one regime isn't a strategy — it's a market-timing bet. Backtest across multiple years to confirm your edge holds when conditions change.
If your strategy is built around a specific economic cycle (rate cuts, dollar weakness, geopolitical risk), test across the equivalent prior cycle. Out-of-sample data is the only honest test.
Why Did My Live Bot Underperform the Backtest?
Live results almost always come in below backtest results. Three reasons explain most of the gap.
Slippage and spread. Backtests assume your fill price equals the bar's signal price. Live, you pay the spread on every entry and a few pips of slippage on volatile moves. Build a 2-3 pip cost buffer into your gold strategy assumptions.
Look-ahead bias. A strategy that uses next-bar data, future-resolved indicators, or repaints on close will look incredible in a backtest and fail live. Quantified Strategies has a clear breakdown of look-ahead bias — read it before trusting any backtest result.
Broker execution differences. Different MT5 brokers fill differently. Test on a broker that mirrors your live conditions. PineForge connects to MT5 brokers including Exness, IC Markets, and most ECN providers — your live execution will track much closer to your backtest if you stay on the same broker.
One PineForge user — David L., a swing trader — backtested a gold strategy that posted a 74% win rate over two years of 1H data. Three months after deploying it live on his MT5 account, the live win rate was 71%. That's the kind of small gap a clean backtest produces. A 30-point gap means the backtest was wrong, not unlucky.
Can I Use the Same Strategy on Other Timeframes?
Sometimes. Gold's microstructure differs significantly across timeframes — a strategy that wins on 1H may fail on 15M because the noise-to-signal ratio is different, or fail on 4H because the entries become too rare. Always re-backtest on the new timeframe. Don't assume.
A faster way to test timeframe robustness: run the same strategy across 30M, 1H, and 4H windows. If it's profitable across all three, you've found a strategy with genuine edge — not one that's secretly overfit to a single bar size.
Conclusion
Three takeaways from this guide. First, the 1-hour timeframe is the sweet spot for gold — enough trades for statistics, enough range to overcome costs. Second, profit factor and max drawdown matter more than win rate every single time. Third, real money is the only honest test, but a clean backtest dramatically narrows the surprises.
You don't need expensive software, a coding background, or weeks of setup to backtest a gold strategy on 1H. You need a Pine Script, the right date range, and the discipline to read the metrics correctly.
Backtest your strategy on PineForge — pay-as-you-go, no monthly fees, results in seconds. See whether your gold bot has an edge before a single dollar is at risk.
Start Trading Smarter
Build, backtest, and deploy your strategies with PineForge. No coding experience required.